The IWM/SPY ratio has failed to move productively. While this is not a big hit, I’ve taken this trade off. Here is a view this morning.
This trade takes up a good amount of capital, as you are trading two vehicles for one outcome.
TLT is still within its T, but there are constraints on rates. More on this shortly.
As for the volume oscillator on equities, there’s so much noise regarding the meaning of the low readings on participation in this rally. That by itself is inconclusive on direction, because when the VO moves lower money is being removed from the market, waiting to be put back in to the market. But the Complex/Simple chart has built up complex resistance at the zero line. Keep in mind that the VO represents the MACD of up/down volume on the NYSE. That means there’s resistance at creating a positive volume flow.
I don’t trust this market, but that means nothing as long as price continues to move higher. It’s been easier to be long Treasuries.
You may have noticed a new chart on the menu for a T on Exxon. It’s based on the technical indicators, not price. This hasn’t triggered yet, but I’ve taken a small position. My stop is 54.
Please keep your eyes on the charts in the menu, as I do make notes on them. Also, please look at the unmarked VO chart, and make your own observations.
While the VO appears to have created a new T, it will still adjusted lower this morning. The McOsi, which is updated after the close, has not passed the zero line.
The note was posted on the chart yesterday. Please remember to check the charts for updates that don’t require a post.
223 on IWM will be a hard nut to crack.
TLT hit that 147 number (and lower) intraday. That is closing price support.
Are you paying attention? Because the market has continued to make bonds the “Easy Ride”. As of yesterday, TLT was up more than 8% from my June 6 post. That is the equivalent of more than 320 SPX points. And as expected, yesterday seems to have been a temporary top in TLT.
Additionally, the IWM to SPY spread narrowed by .6% since my last post as of right now. While that is not a great return, I hope that some of you are using the charts in constructive ways. For example, we hit the mid-Keltner line on SPX during yesterday’s rout. That could have been used as support to buy back some or all of the SPY short. It depends if you are trading or investing, and since this spread is a trade, you’re okay to trade it like an options spread. At 209, IWM was very close to its 200 day MA of 206. And 4236 was the middle Keltner band. As I’ve pointed out on the companion chart, in a bull market, price should top out when we are near the top of the Keltner bands, and RSI and MFI are in overbought territory, finding support when RSI and MFI hit 50. That’s pretty close to what happened yesterday. We had all the ingredients for a low risk trade, not investment. Personally, I think this spread is going from .50 to .54. That is a 4% trade.
So where are we now? We seem to have hit an important resistance point on SPX of 4332. I’m not sure there is enough power to get through that right now. My post last night on Elliotwavetrader.net was as follows:
“The last regular Equity T ended on April 29 with SPX at 4211. We closed today about 1% above that. Hopefully today’s move will initiate another T. But rather than have 6 months of strength, we may only have 6 weeks. Today’s VO will be adjusted higher early tomorrow, but the McOsci in purple shows a lower low. That’s not a good sign for immediate strength. We did bounce at the mid Keltner of 4236 today, and RSI and MFI hit the 50, where they could bounce.”
Had the VO continued lower today, we could have possibly moved to a ‘Bear T’, which is when the VO gives a lower low within an existing T. That has not happened and the VO stopped at -95, which is above the last -150 low reading. While we are not in an existing T, the idea of a lower low right now would create that type of dangerous situation.
Clarifying my Elliotwavetrader.net comments further, the BPSPX is definitely not in investment mode, the Simple/Complex chart is not showing us a complex-building bullish sign, while the Simple Chart is still relatively bullish.
We need TLT to stay above 147 at this time as support.
Keep in mind that the IWM/SPY paring must stay above .47 to keep the trendline positive. It fails below that number.
A different but important view of this spread can be found here:
TLT has moved back above the daily Keltner Bands, and there is also an hourly T from July 8, with a center point of July 13, that expires on Monday.
While the T should last until October, it may be wise to get some protection .
Daily chart Hourly chart
In other observations, IWM reached a point intraday where it was 8% lower than SPY over the last month. It is a low risk/reward to be long IWM vs. SPY, regardless of market direction.
IWM has fluctuated from being priced between 62% and 54% of SPY for many years. It is also at support from a more recent trend line. It is now at 50%. This doesn’t mean that it can’t go down, but in a spread against SPY, the risk is low.
Well, a week has passed. SPX does not look like its moved much. Thursday’s move created a price low, but was inconclusive for a Volume Oscillator bottom. My note of June 24 suggested that the VO would peak below the zero line, and since then it has begun a move lower.
The Companion Chart is showing us that price is still in a peaking period, and technicals are a bit overbought. In a bullish environment, I would look for 50 to hold on RSI and MFI.
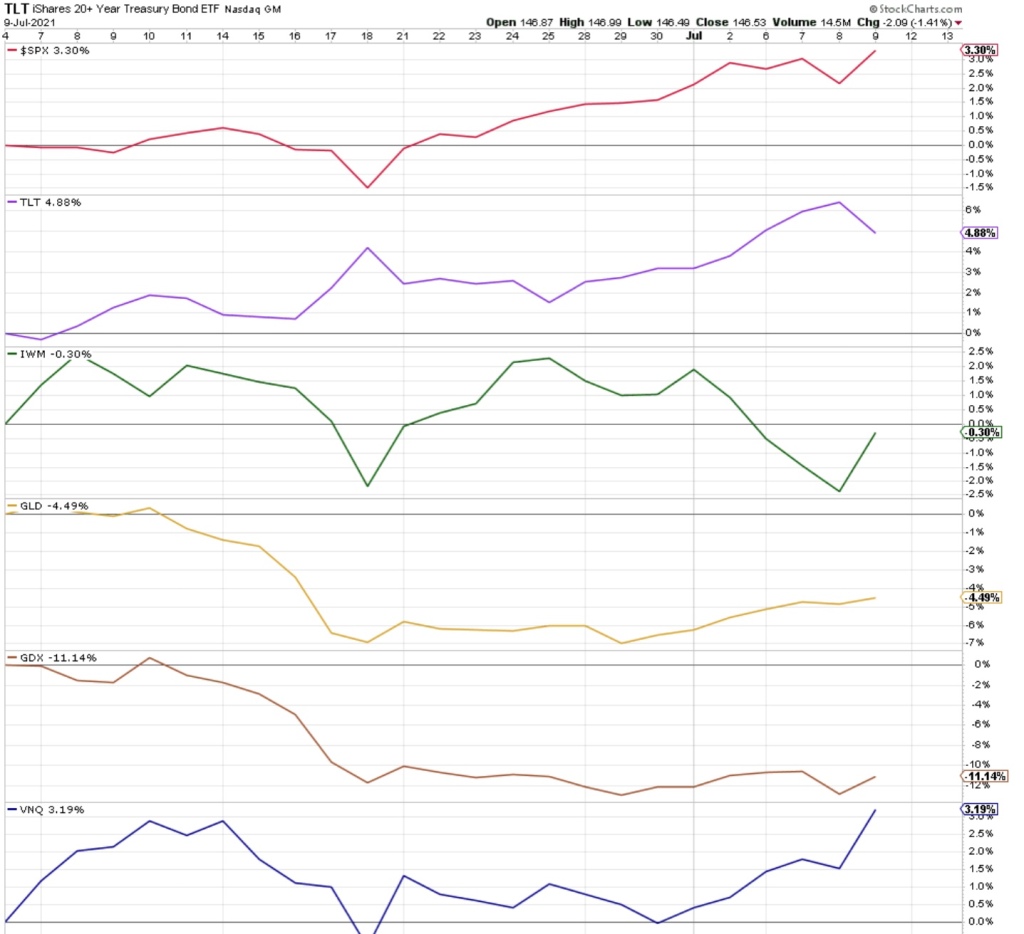
We are still in the best asset class since June 6, as this week SPX is up .5% and TLT is up 1%.
Asset Class since June 6
But we have issues in TLT. It moved above its upper Keltner band, and has since crossed under the upper band. I would expect it to tap the daily middle Keltner line on this reset. We’ve seen this in other assets before, as Terry Laundry called this “Frog Jumping” from one line to the next.
You can see another example of Frog Jumping in this Andrews PitchFork chart of the 30 and 5 year bonds that I’ve been tracking for the last 10 years:
Getting back to TLT, using standard Keltner bands (rather than Terry Laundry’s equity Keltner bands), 144 should hold instead of 142, as shown above.
Looking at a weekly chart, the damage needs to stop above 144. I would protect profits below this.
With US bond sales coming this week as well as bank earnings, the catalysts are clear.