The XOM T is Over

The XOM T should have completed a period of strength yesterday. Instead, it brought the potential for a strong move lower next week.

Click on the chart for a live view

This T had a center point of July 20. It was a strong area of support based on price, RSI, and MFI lows against their respective bands.

It was evident that XOM could not crack through its middle Keltner, nor 50 on the two technical indicators. When price dropped below 53, this structure became a Bear T. A Bear T has a lower low than the center point of the T. Near the end of the T, there is usually a rally from Hell, which is followed by a price collapse. That is the expected outcome at this point. I think XOM has shown all the ingredients of this potential.

Unfortunately we have the potential of a hurricane passing through the Gulf, which is both alarming on a humanitarian level, and may have an impact on the future of the chart. I can only account for what the chart tells me.

With the “Weak T” on the McOsi ending September 3, the outlook for equities is in jeopardy. (Please ignore the last VO reading as StockCharts hasn’t updated it yet.) The McOsi has peaked at the same level as the last descending high trend line, unless Monday’s action moves it higher.

Click on the chart for a live view

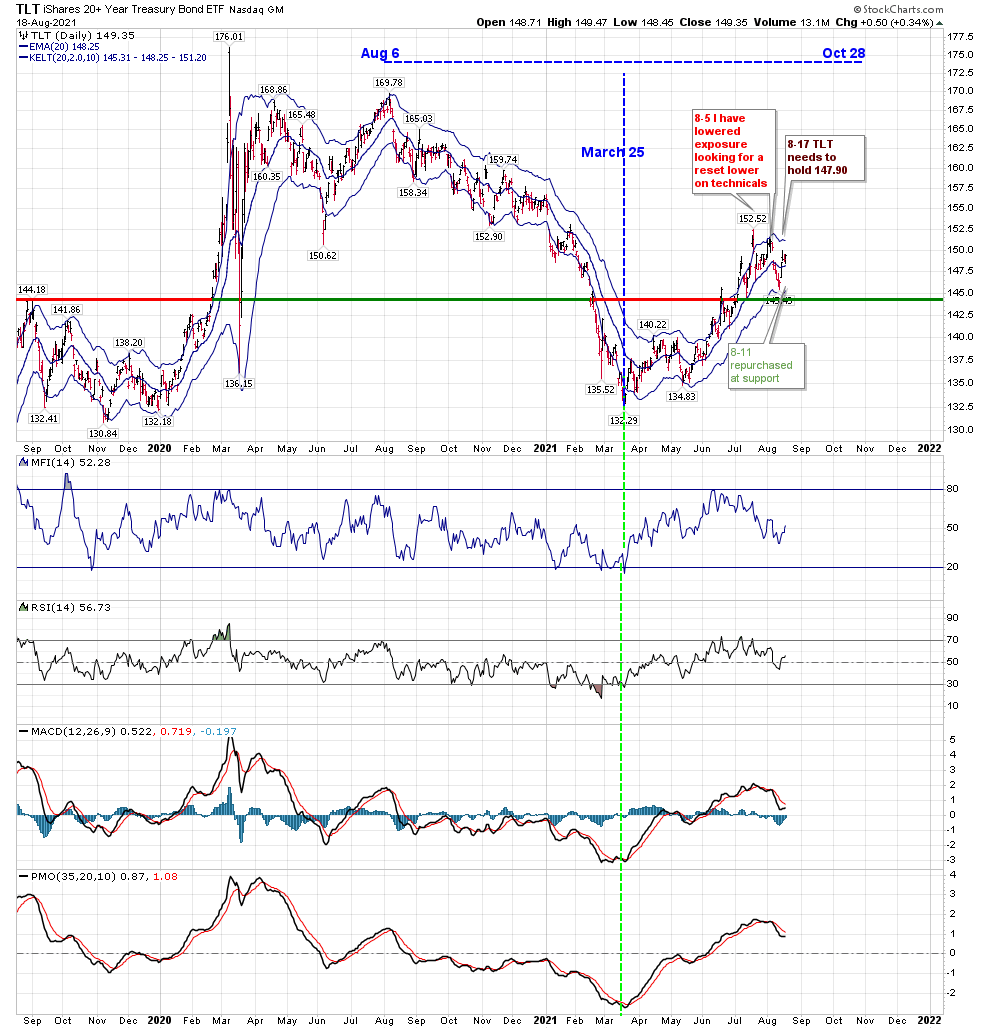
As for the T in TLT, we have stayed within the 144-151 range I have suggested. For those who follow me through Avi Gilburt’s site, you know that I sold calls around this week’s high, and repurchased them around 148, the day before Jackson Hole. While this enabled me to regain some of the reduction in price, it didn’t cover it fully. These were ITM options, which moved to OTM, leaving time premium.

Click on the chart for a live view

It’s become clearer to me as to how the T in the Ten Year Bond can exist as well as the T in TLT. This T can continue to result in higher rates, which longer term bond holders may accept as helping to keep long term rates lower for longer. I will shortly be taking a converse position on IEF or use some other vehicle. I don’t intend to post on that position.

Click on the chart for a live view

Below is a chart showing the asset class performance since the T in TLT was discovered. Returns were increased by successfully trading my TLT position.

IWM has shown a surprising amount of strength recently. Its value has returned to 50.03% of SPY.

It is still below the resistance level on this chart. Watch for a breakthrough.

Have a safe and enjoyable Labor Day. I don’t expect to post before then. This is a copy of the present chart before I remove some old comments and lines:

Chart as of 9-2-2021

Added Pressure

In last weekend’s post, I mentioned that I would close the XOM T if it closed beneath 56. It closed at 55.94 on Monday, and I closed the position. With a new low in price, the T is now a Bear T. That means expect weakness for a week, then a sharp rally that fails. Watch for 50.61.

The expected rally does not mean there will be new strength in Exxon, but a sharp rally before collapse.

Regarding equities, I also noted in the August 14 post that there is no T in equities. Even though price is higher by 9 SPX points as I write this, the VO for today (which is incorrect, but shows direction) is not bouncing.

As noted on the Simple/Complex chart, we had a complex structure that was capped at the zero line.

We held this morning at 4367 SPX, and the mid-Keltner is about 20 points below that. We need the 50 RSI and MFI to hold in order to create a low. We broke the trend line from March 2020. I expect this week’s Options Expirations to gyrate price through the close Friday.

Being in TLT is still more rewarding, even if we are on the lookout for a top at 151-152. This morning’s high price was 150.99.

I hope some find this update helpful.

Knowing Your Limitations

Sometimes it’s helpful to know the smoothest ride. Since recognizing the T on June 6, it’s up over 7%. Over the same period, SPX is up about 4%, or about 160 points.

While SPX can go up indefinitely, TLT is bound by what it represents–rates.  I don’t see us getting back to the rates we had a year ago, and that binds TLT to a lesser number than its all time high. (That is not the case with SPX–the sky’s the limit.)

We have had 3 declining tops from 152 on TLT, and I think that shows its limitations:

A pasted image

Back in December I posted a TNX chart showing a rate T which would last until the end of 2021. Luckily, I acknowledged in early June that it was in conflict with the TLT T.

That chart is posted below, along with the earlier TNX T‘s that I suggested as they occurred. This T may once again begin to control the narrative.

The TNX chart in the menu shows the shorter T, which ended in May:

I am now on high alert as to whether or not we have a sustained rise above 50 on the RSI chart, and whether MACD kisses or crosses.

In my opinion, we may stay between 144 and 151 in price on TLT until the TLT T ends in October. This is based on staying below 1.43 on the Ten year until that time.  I don’t like talking fundamentals, but even if we begin tapering, bond holders take that to mean that longer term inflation will be kept in check. That would keep interest rates lower for longer, even if not as low as in the past.

Conflicting Charts, Price Moving Higher

I did not track the NYSE McClellan Volume Oscillator until recently. The McOsci, as I refer to it, is available hours after the daily close, while the VO gives an incorrect reading until Stockcharts updates it the following day. Recently the McOsci has been a better arbiter of price than the Volume Oscillator that I have traditionally followed. Following the McOsci, you can see a T with a left edge of June 1, a center post of July 19, and an ending date of September 5. But it is a ‘weak T,’ if just barely one. The McOsci really needed to get above 43, and it failed.

Keep in mind that as the VO and McOsci move higher (with higher lows), money is being dispersed–conversely, lower lows in the VO mean cash is being built up for the next advance. A T looks for bottoms on cash buildups as investment areas in a bull market.

According to the VO that I have used for years, a T has not formed. When two views using similar evidence point in different directions, it creates a murky view of the future. Additionally, based on a September 5 conclusion to the McOsci T, I would look for turbulence around Friday, September 3. It’s perhaps worth noting that September 3 marks the beginning of the Labor Day weekend in the US.

REVIEW OF THIS YEAR’S T’s

The last major equity T had a center post in March 2020 and lasted through April 29 2021. Since the end of that T, SPX price has moved from 4211 to 4466. That is about a 6% move, and for investment purposes, it’s always great to have a positive performance. I have not had an equity investment T confirmation since April 29. I can’t force the creation of a T, and I follow my rules. You can find them on the Concepts page.

Reviewing this year, using T Theory we garnered all 500 points (14%) from December 25, 2020 through April 29, with additional gains from my December 21 post which explained things were not going to be easy, and when to take profits.

Prior to recognizing the present TLT T, I posted on December 25 that there was a Ten Year Bond T that would continue throughout this year. TLT was at 156 on December 25. As I posted here on June 6 (with TLT at 139), a reversal was in order with the creation of the new T on TLT. Since June 6, the present TLT T has manufactured more than an 8% return, when you include the timely moves in and out of it.

The Exxon T has not garnered any profit, and is minimally behind. I will not be patient with it much longer, and have set a closing price of 56 as a stop.

GOLD

I have been known to be a gold bear, but the truth is I am more of a miner bear. In my mind, miners are dumber than rocks, or at least much less valuable. Looking at the chart below, GDX was at 31 in 2007 when Gold was about $600 per ounce. Unlike oil, which is mined and then utilized, practically all the gold ever mined is still in existence. There’s about 45,000 tons of gold that have been mined over the last 15 years, considering the Gold Council’s estimate that 2500-3500 tons are mined each year. How does adding more of an existing commodity raise the price of that commodity? Mining companies seem to always shoot themselves in the foot when it comes to mergers, hedging, or adding to their capital expenses.

In any event, that doesn’t keep me from looking for opportunities when GDX is close to 31. Between 2014 and 2020, I posted many times on Avi Gilbert’s elliotwavetrader.net that I did not see GDX making it above 31. But now I feel that 31 is extreme support. For a trade, because miners are still dumb.

I have posted this contrarian chart on the discount to NAV for two major gold funds in the past, and once more I give credit to Carl Swenlin of Decisionpoint for creating it. While many were laughing at the gold futures trade that marked gold down over 4% (for a few moments) last weekend, I think it is more relevant (and potentially profitable) to look at gold when we can all purchase it at such an extreme discount.

Gold negative sentiment is reflected by extreme discount to NAV

Even with Friday’s move higher on GDX, the discount grew in Sprott, and fell only slightly in the CEF. We are close to a buy. For a Trade. After all, we have completed Terry Laundry’s 20 year bull market in gold, until the next one starts.

Let’s see what happens around September 3. Stay safe.