Can we say Positive Outcomes are here again? At least temporarily. The last remaining fixture of doubt was removed on October 25, when the BPSPX crossed the middle Keltner line in a positive direction. The “simple chart” has also continued to move higher, finally giving positive readings of both Volume and Breadth momentum.
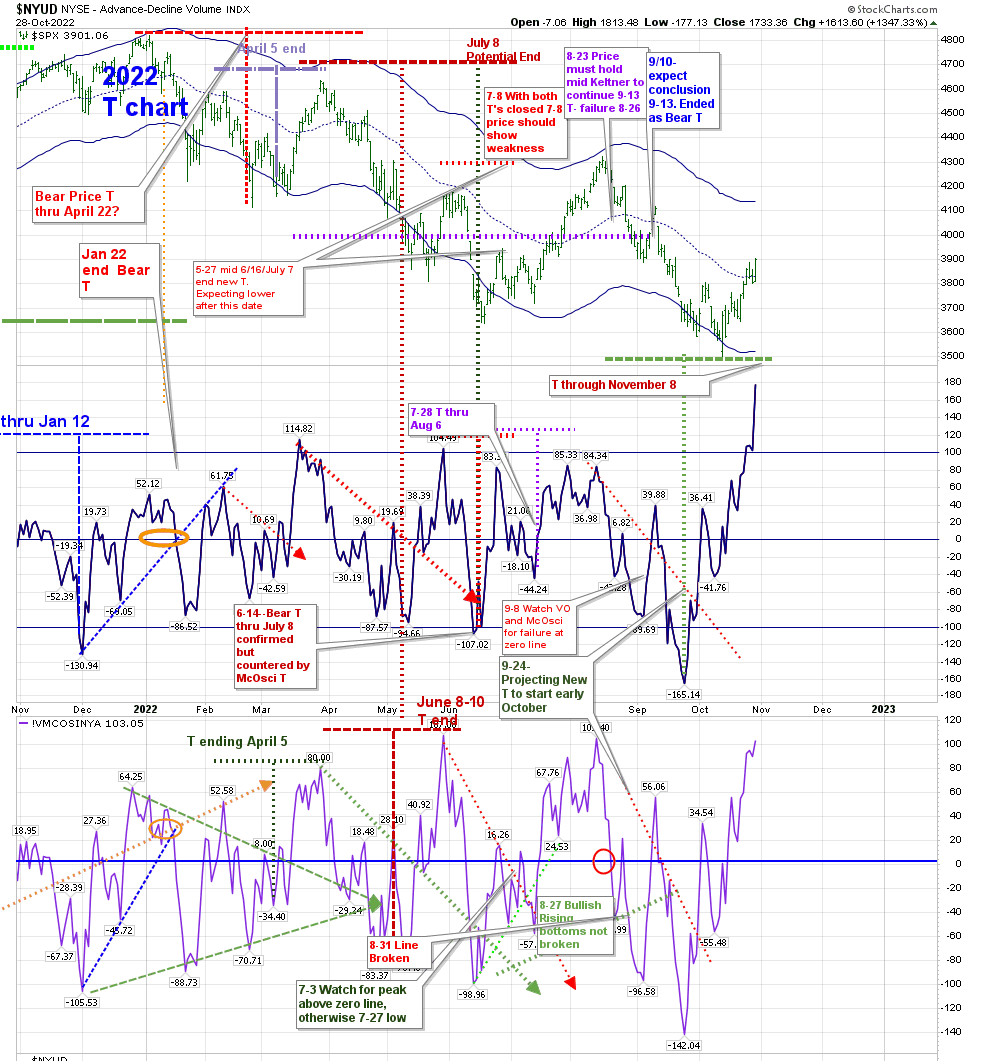
After Price hugged the middle Keltner band for the next few days, it rose yesterday. It appears the T discussed last week will have its positive conclusion on November 8.
It will be important to see how Price reacts to the next move down in the Volume Oscillator. Remember that there can be different results to this phenomenon. Should Price continue to climb as the VO resets to the zero line, more Positive Outcomes may occur. If Price moves down with the VO, we could revert to more failures.
It appears that yesterday gave us that 3% move in Price as the expected inflection point occurred. But it was a double barrelled one based on how futures initially reacted to earnings on Thursday evening, as there was a 2% move lower on a day that was already down by almost 1%.
We aren’t quite overbought on RSI yet, but getting close to it.
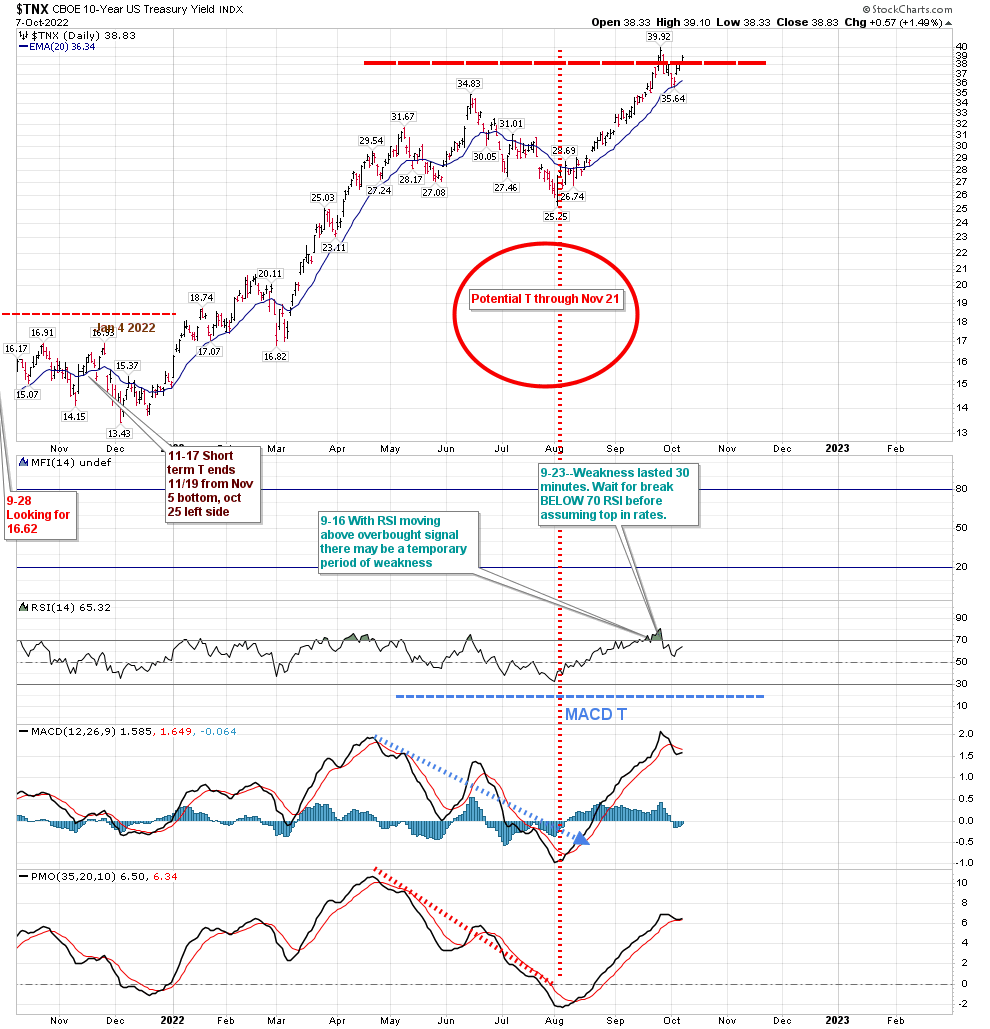
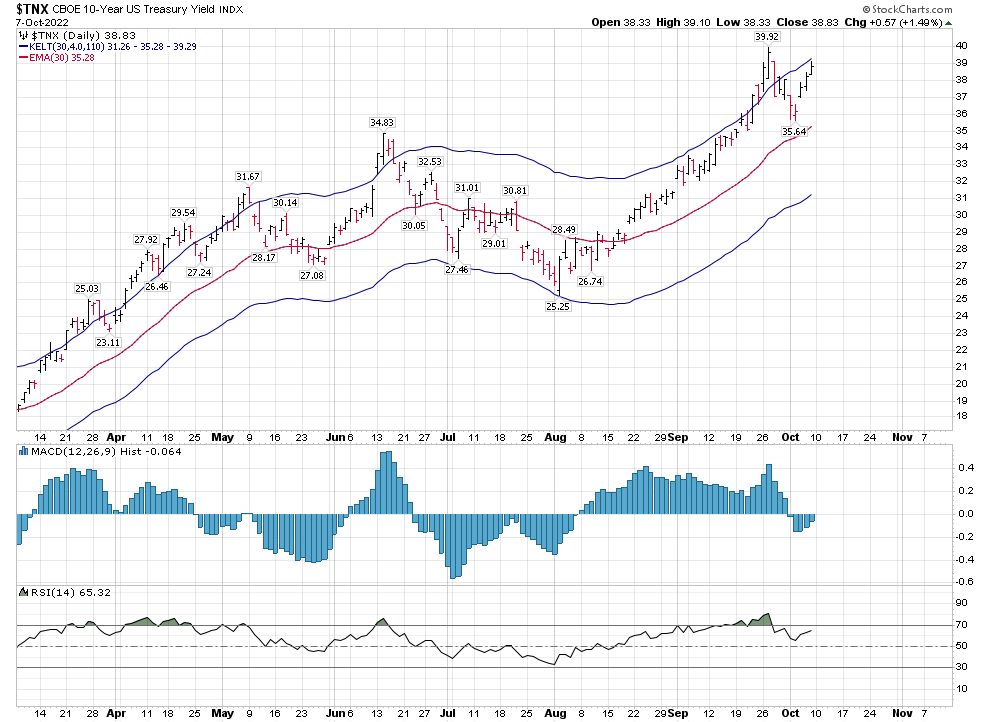
As for the Ten Year T, we once more bounced off the support of the 20 EMA. RSI has reset near the 50 (neutral) range, but MACD and PMO are definitely pointing lower. We’ve reached the MACD of June 21, which helped us define the MACD descending trendline. Of course, this week should be a critical one for this chart.
I want to begin by saying that we have a T at last. The Volume Oscillator confirms it, based on the criteria I stated in my post of 2 weeks ago. The McOsci, unfortunately does not yet concur. Let’s look at the Unmarked T chart:
As stated in my last report…
“… while a new T can be built when the VO passes through the zero line, it is not a confirmed T until it has a higher peak than the last peak of the descending Cash Buildup period.”
We have that now, but I’m not invested in it. (This was the bullish T that I was mentioned in the Sept 17 report Time Moves On.) That doesn’t take away from the fact that it exists through November 8. But as I stated above, the McOsci hasn’t confirmed it at this time.
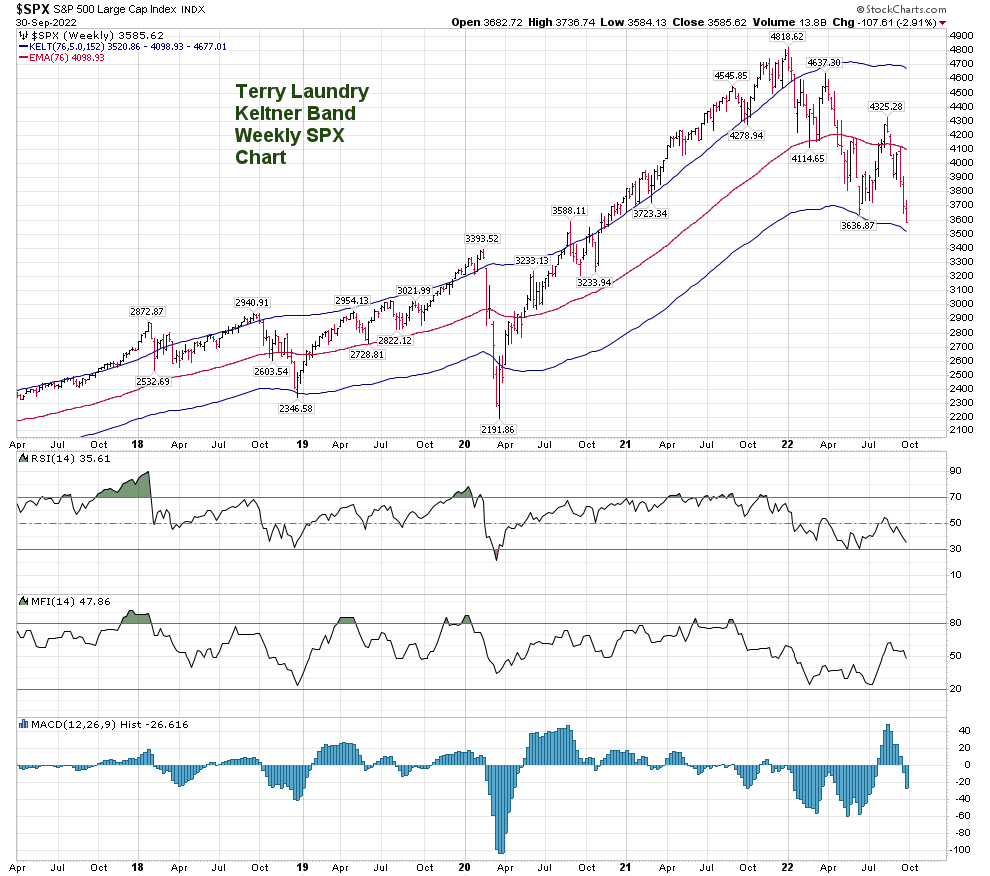
We hit the bottom of the Weekly Keltner Band and reversed that day sharply.
Does this mean that we will continue higher? Perhaps we can move towards the weekly middle band of the Keltners as we did from April through August. Time will tell.
While Time is telling that story there are some clues on the daily chart. RSI has just recovered the 50 reading that has kept it down since August. MFI is at that same point. The MACD is advancing will from a deep low. But we have been stopped here before. I’d like to see momentum drive us past these hurdles. I haven’t seen Positive Outcome Conclusions. I want to invest for longer than 2 weeks.
You can also see on the above chart that we are reaching what may be an inflection point during the upcoming week, as noted by the vortex point of the dashed blue and green lines. That has created 3% moves each of the last 3 times we came to one of those. Perhaps a great time for a straddle?
Two weeks ago I noted that daily support was 3743, and resistance was 4050. Today’s middle Ketner band is at 3829, which is potential resistance, while lower support extends down to 3520. The shape of this decline has lowered both by over 200 points in two weeks. (We were about 120 points higher 2 weeks ago.) Did we get that culmination event at 3491? It’s possible. Let’s see if we can hit the middle Keltner and continue forward.
The “Simple Chart” is rising from an awful low in both Intermediate term Breadth and Volume. That’s a positive. But I don’t need to catch a falling knife, and I am waiting for them to move closer to showing positive Breadth and Volume.
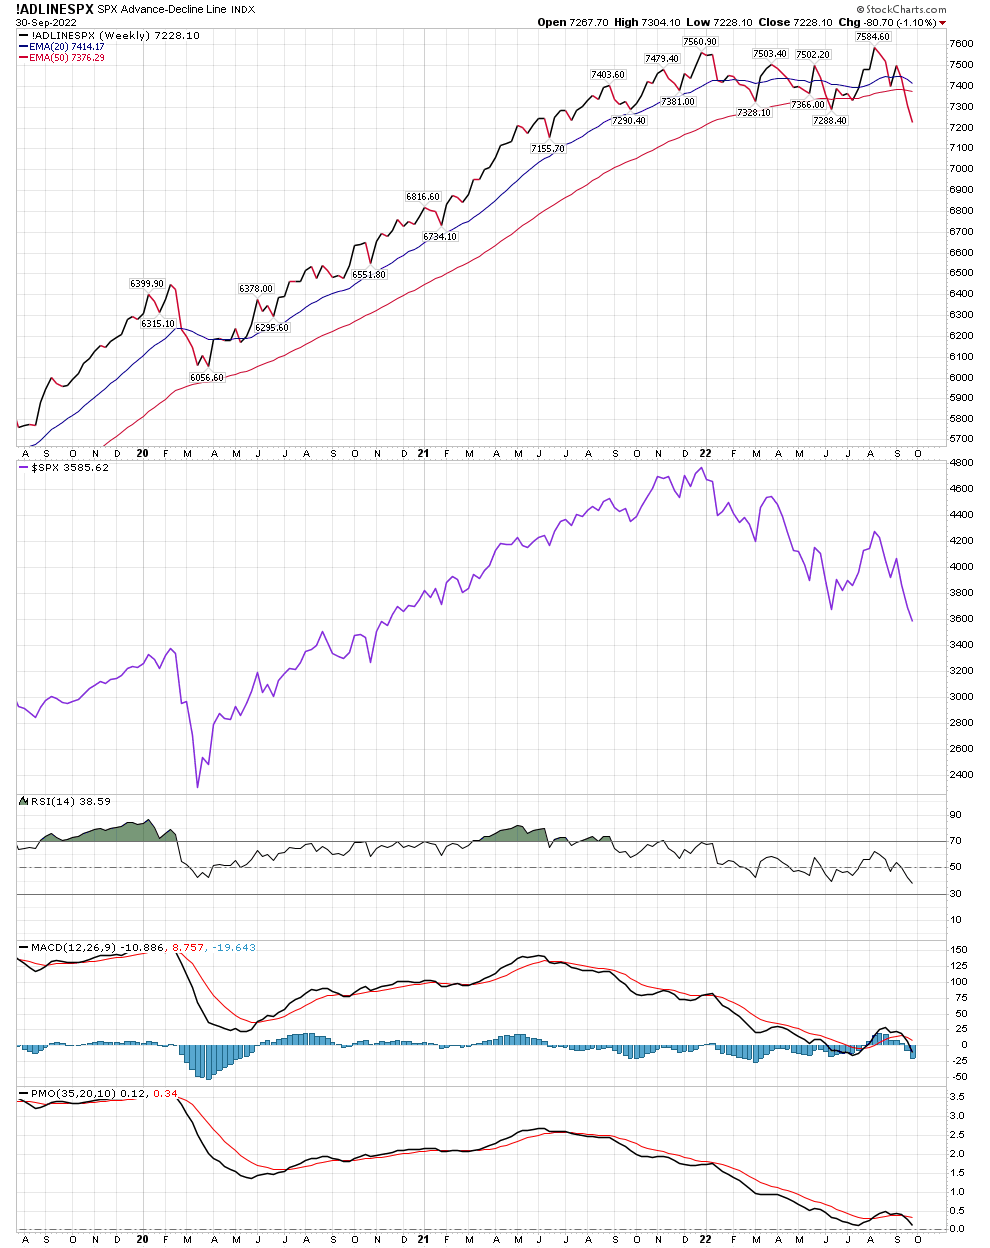
Another good sign is the Weekly Advance/Decline number has turned up just as the 20 and 50 week EMA’s were about to cross negatively. I call this a kiss instead of a cross. We need another few weeks above this cross to assume the worst is behind us.
The true rub in the situation for investment in equities is the Bullish Percentage on the SPX. We reached a low reading of 11 at the end of September, and recovered to a reading of 33. The reading was so low that the lower Keltner band is at 25, with a middle of 37. Should we exceed 37 we have a buy signal. The last buy signal was at 32, and lasted until we crossed below the Keltner at around 70. The prior buy signal was at 34, and did nothing for us in regards to Price until it crossed negatively around 60. The Support Area on my chart begins around 41. Below that there is more risk in assuming we will get a Positive Outcome because there are very few stocks participating. (That’s kind of an important statement.)
So to sum up, there are lots of reasons to assume higher prices through November 8. I am showing my personal bias by not investing in it at this time. I want to see a Positive Outcome conclude that way. It’s a good thing my advice is free, because my conservative methodology is not giving an edge.
++++++++++++++++++++++++++++++++++++++++++++++
Where there is more clarity is on the 10 year rate T. RSI is overbought, but the MACD and PMO have both turned higher from an overbought condition.
This T has been very successful, to the point of being painful for bond investors. I have been laddered in individual bonds since April (which initially matured through January) and some have renewed at greatly higher rates. I believe these major rate increases may stop before this T ends, as short term rates may rest while this Ten year T continues through November.
If you followed my posts on rates this year, we’ve managed this environment quite well, with the Inverse T on TLT, the 30 and 10 year T’s.
While I don’t talk about the fundamentals much, I believe one of the benefits of these higher rates will be that the Fed has renewed their ability to lower rates to manage any future crises, and will not have to revert to negative rates in the future. Comparisons to other countries who do not work as the currency of the world may be inappropriate.
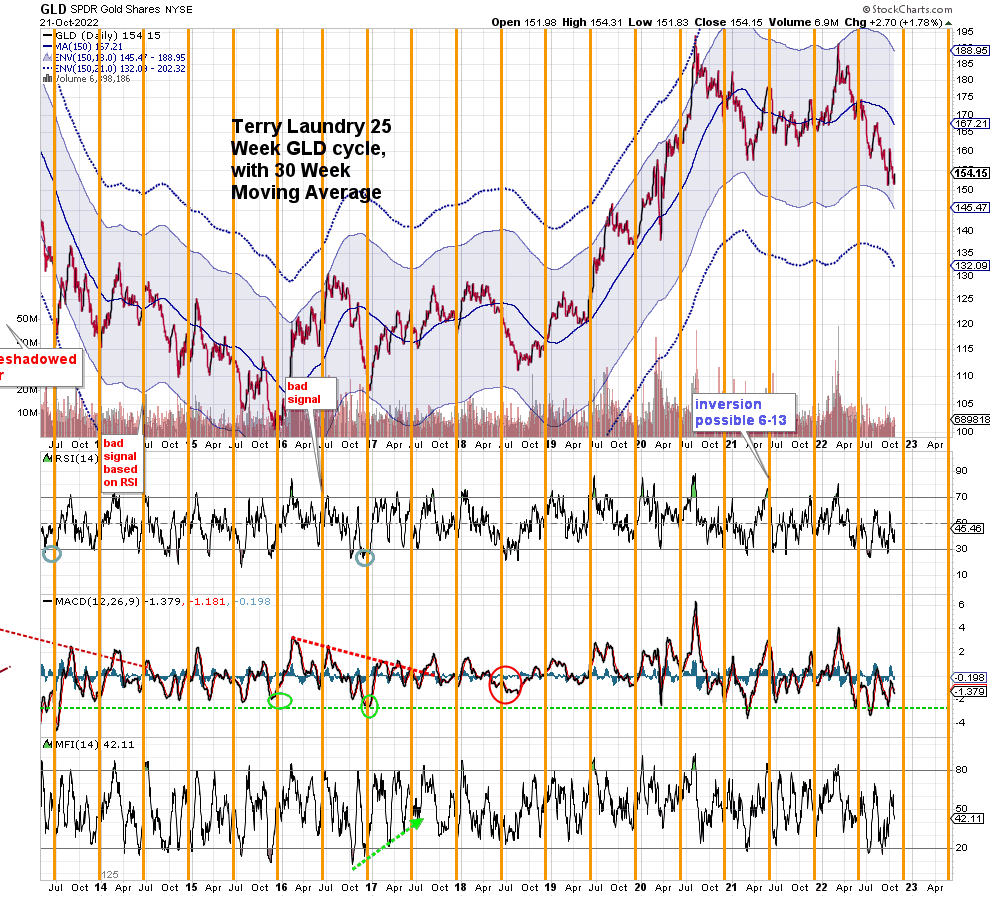
We are approaching the 25 week Gold Cycle with fairly good readings. It would be helpful if GLD moved lower over the next two to three weeks to reset the technicals further.
A tumultuous week has passed since my last report. Since early this year the theme of this site has been on the failure of Positive Outcomes. We had another such failure this week. Please keep in mind that this site is used as a journal by me, and is not intended to offer investment advice. Like most of you, I’m just someone spending too much time watching the tape. I take a very simplistic view of the market’s technical status.
Years ago, I was a subscriber to Carl Swenlin’s Decision Point service. As someone involved in Quality Control, I found relevance in Decision Point’s simplicity, yet functionality. I’ve pointed out that a few of the charts on this site owe their roots to Decision Point’s free charts. They work very well with the simplicity of T-Theory. They’re not complicated, but Price has a way of making fools of us all when we don’t follow simple rules.
Looking at last week’s report, I made the point that a safe period of investment will come when the VO and McOsci move above the zero line. They did that this week, after a 200 point run.
Why didn’t I put a new equity T in place on this chart? There were a few rules that need to be reviewed. Firstly, while a new T can be built when the VO passes through the zero line, it is not a confirmed T until it has a higher peak than the last peak of the descending Cash Buildup period. In this case, the VO would have needed to pass 40 before heading down. That’s not my personal rule, but one that Mr. Laundry followed. Secondly, back in February of 2021 I developed the Theory of Complex versus Simple Structures. This theory suggests that when we get a sharp reversal in the VO or McOsci, it is a weak directional signal unless it builds a complex form. Here is the chart as marked on this site:
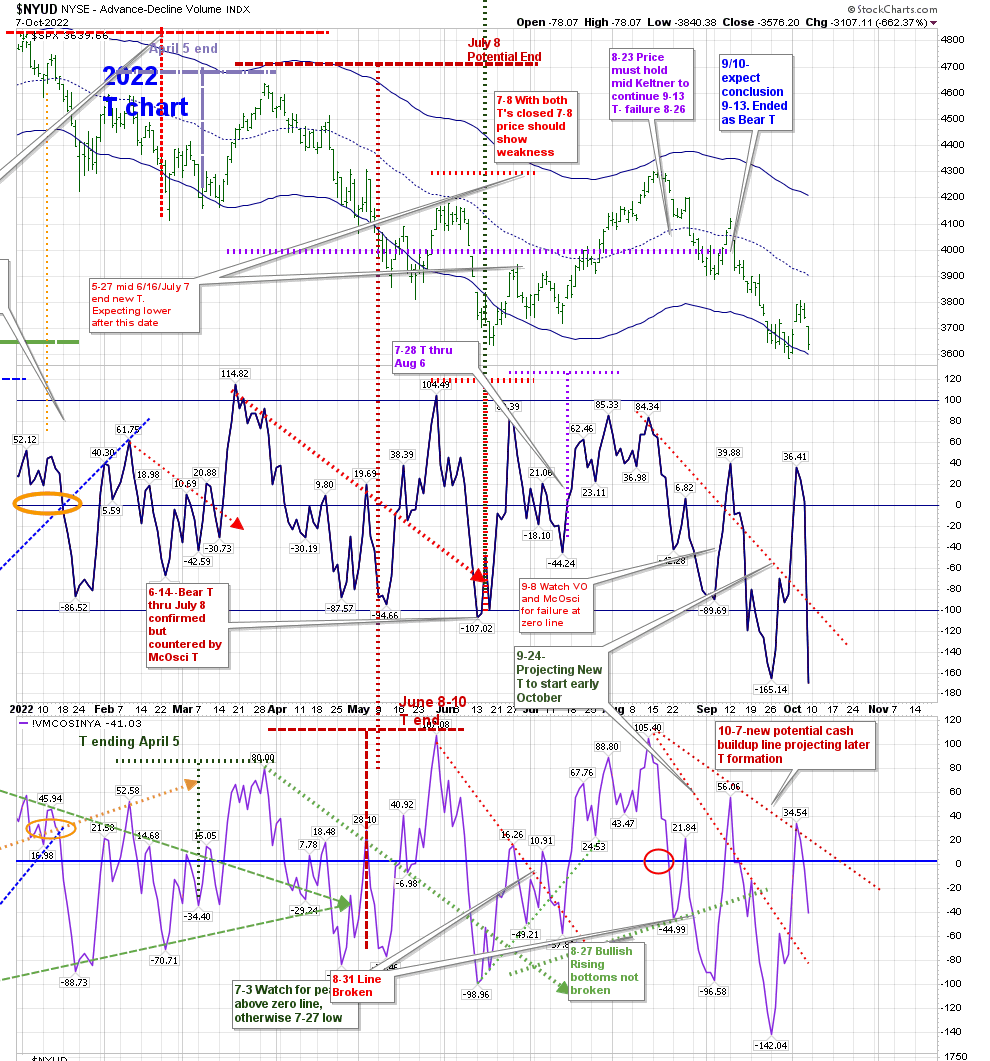
The newly marked McOsci Cash Buildup line now has a new set of declining peaks from its mid-August high. It is projecting a longer period of continuing weakness before the next T can begin. The light at the end of the tunnel is that the longer it takes to create the center point of the next T, the longer that Cash Disbursement, or strength, will continue from that low.
Here’s the marked T-Theory chart from the site’s menu:
Simple technicals failed to create a positive outcome after that 200 point rise early this week. The “Simple Chart” shows an attempt by (Intermediate Term) Breadth and Volume to crossover this week. Instead, they just kissed without crossing, even from a very deep reading. These readings appear to be incredibly weak, to a point where they are reaching levels they only exceeded in 2020. But when one takes into consideration the sustained angle of their descent, they are continuation moves, rather than what occurred in 2020, which was event-driven.
I have been writing about that ‘Evil Cousin”–the 2000-2002 bear market. I do so not because I expect a recurrence, but to acknowledge the fact that “corrections” can last much longer than we have been used to over the last 10 years, and they have different formations on their technicals (RSI, MACD, etc.) than we have become accustomed to. Notice how these Breadth and Volume continued to deteriorate during that period to extremes before subsiding:
A look at the Bullish Percentage Index shows us that we have also turned away from moving back within the Keltner Bands:
In other news, the Advance/Decline and SPX Price both advanced higher this week. That can’t be ignored. Price is the final arbiter, although the RSI and MFI were both turned away from their respective 50 readings again. From this investor’s perspective, it has become harder to keep from pushing that buy button when we have 200 point moves higher. Price is looking for any reason to smash higher, and at this point the opposite moves we had (as we moved lower later in the week) lacked enough conviction to renounce the entire earlier advance. I consider bounces to be just bounces in a down-trending Price market until the charts prove otherwise. Rules are rules, and until Positive Outcomes return, there is no rush to reinvest.
The Ten Year Bond T based on MACD and PMO continues. It ends November 22. It was expected that Price would move back to the middle Keltner after piercing above, then below the upper band. That middle Keltner acted as support.
There is a button on my keyboard that allows me to buy or sell stocks at any moment. I have been staring at it since August, unwilling to press it, watching ‘huge’ daily rallies, wondering if I have missed a buy signal. But when the dust settles, I see that once more I’ve correctly monitored the situation and held off from making a mistake. In a market that is down 1250 points from its January high, there were 2 periods of strength this year that gave me positive results for a long-only investment account. These periods of strength were the T’s that ended April 5, and the T I removed myself from on July 8. (There was a third period of recognized strength which ended mid-August, but as I was aware that I wouldn’t be able to extricate myself from it manually, I let it pass without investing.) Using Terry Laundry’s major principles allowed me to have double digit positive results this year, utilizing a process which is either all in, or all out of an asset class.
For the past ten years when an equity T ended it was my practice to place my funds in ETFs of either the ten year or longer term Treasury. As stated in the T-Theory Concepts page– When a T ends, expect the period of strength to end, and for the return on equities not to exceed that of the ten year Treasury. However in an environment of rising rates, I decided in April to go a different route. Since then I’ve been using laddered Treasury bills as a parking spot for cash. The ladder is from 2-8 months. Using actual Bills rather than ETFs or mutual funds has resulted in a return of principal, with some added interest, rather than the deteriorating price of those ETFs in the face of rising rates. The T’s that came to the 30 and Ten Year Treasury, plus the Inverse T on TLT have all worked out as planned, reducing Price on Bonds while Yield expanded.
I’ve made a few points over the last few months that I would like to repeat:
A safe period of equity investment will come when the VO and McOsci move above the zero line. Unless you require yourself to bottom tick the next major low, a new T will allow you time to enter. The longer we have to wait until that Center Post occurs, the longer the period of strength that will follow.
While interest rates have moved quickly higher recently, that is not how they normally work. There are zones in which they can rest for years. Watch for MACD turns on weekly and monthly charts to gauge their direction.
Terry Laundry’s Confidence Index needs to reset to a wider spread between High Yield and Treasuries in order to create long term security to interest rates and equities.
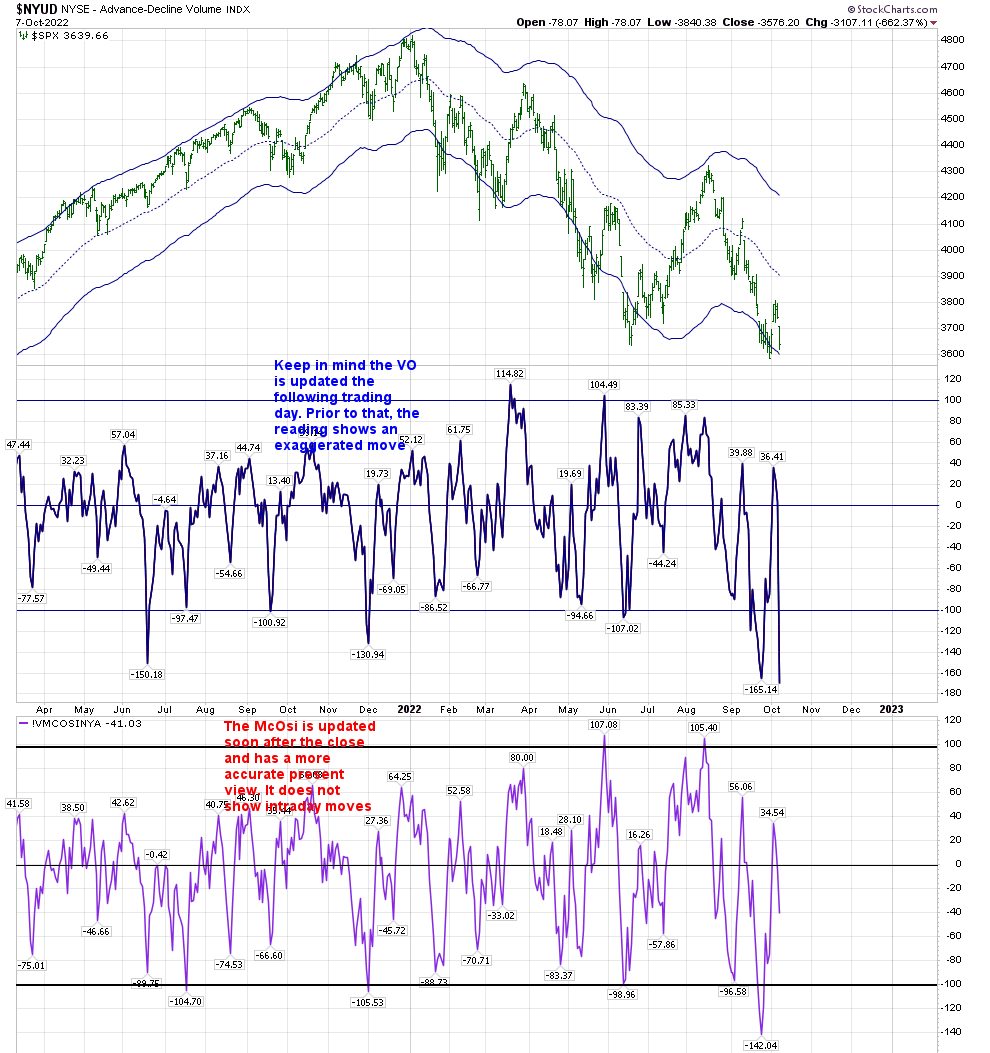
Based on the readings of the unmarked T-Theory Chart, we are building Complex formations below the zero line, and very deep ones as that. I’ve mentioned in my last 2 posts that the best returns occur when we have an upward thrust of the VO above the zero line–that is true on any Breadth indicator. On the other hand, yesterday’s McOsci reading actually rose from the prior day’s close, which could presage at least a short term bounce. I am hoping for a new T to form around the middle of the month. But there is no sign of it as of yet.
Unmarked T Chart
Hourly Price is riding a support line that is below the Keltner Bands.
It’s very possible that Time is waiting for the lower band to meet that support band (in the near future) as the Time to start a rally.
Supporting that view is a look at the Weekly chart using Terry Laundry’s Keltner Band levels. We have a lower low in price with a higher reading in RSI and MACD than on the June lows. We are less than 2% away from that lower band of 3520:
The Bullish Percentage chart is at a staggering low of 11.6 The middle Keltner Buy zone is above 45. We have a descending support line (from June 2020) which we just touched on Friday. (There is a shorter term view of this chart on this site.)
The weekly Advance-Decline Line has passed below both the 20 and 50 EMA, with RSI approaching oversold. Is Time waiting for the 20 and 50 EMA to attempt to cross?
There is no bigger frustration than having that button on my keyboard and waiting to press the buy button. I want to put my investment funds on a road where I won’t have to look at them for a while. Hopefully we will have at least a short term reason to press it soon.
Back in May I made reference to snowflakes, and how each one is unique. I pointed out that while different, there was an “evil cousin” we could replicate. I did that as a reference to 2000-2002, as a reminder that corrections do not have to be brief. Here’s a present view:
Just as the Evil Cousin’s Volume Oscillator shows, if we are going through such an extended correction we will still get massive spikes higher on the VO that will lead to periods of positive returns when we pass through the zero line. I am waiting for those periods of strength to show themselves. Till then,