While I said in my last post that my blog was done, I thought I would take this opportunity to update my thoughts. I don’t expect to post regularly.
There are very few times when I’ve entered the market with investment funds that I’ve felt so uncomfortable. I know this is the wrong time to enter. I feel it with every instinct I have. But I have to fight those instincts based on what I am seeing underneath Price–Strength. Strength of Up Down Volume and in Breadth as charted by the McClellan Oscillator.
I’ve heard that every snowflake is different. Their crystalline shapes are formed by nature, but have infinite variations. To me, every day in the Market is unique. There are elemental triangles that meet and form different shapes. The picture of a market when RSI is rising and Price is declining may mean one thing when Breadth is declining, and another when Breadth is strong. We should monitor all five types of technicals within the structure of Price–trend, mean reversion, relative strength, volume, and momentum.
Looking at the Weekly Chart using envelopes developed by Terry Laundry, the ominous number 3666 is the lower Keltner. While we have hit the low in RSI and MFI that we reached back in 2018, the initial recovery attempt failed, and indicators have turned lower again.

But looking at the Weekly Chart using the same envelopes he used on the daily chart, we have hit the lower keltner:

I am now going to present you with a ‘scary’ chart–1998-2003. It’s a point in time, and I’m not looking for a repetition. But every snowflake has a cousin, and we don’t want to end up related to this one. I show it only to show how important it will be to regain that middle Keltner band:
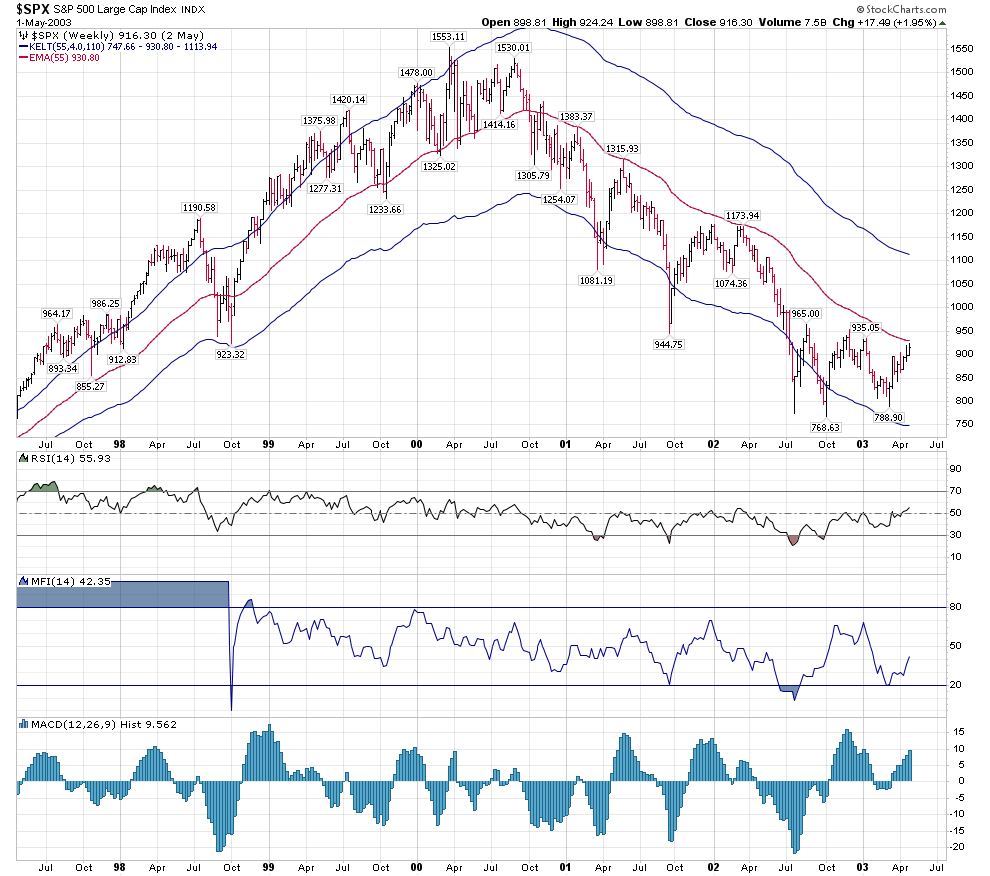
And this is where we start discussing “the present shape of things”.
For those who were following my blog or my posts on elliottwavetrader.net, I have been noting that we have not had bullish or positive outcomes in Price since January 22. We had setups in Price that resembled potential positive outcomes, but they failed to ignite. We had a T lasting through April 5, followed by a Price T through April 22 that ended as a Bear T. And since then I’ve been waiting to redeploy investment funds. Terry Laundry never put tranches into play, and he used a Treasury or Corporate bond proxy for investment purposes. I put my funds into whatever creates a T, and I don’t have a problem sitting in cash.
We appear to be close to confirming a new T. Let’s look at the unmarked T-Theory Chart. It shows higher highs on the Volume Oscillator. In traditional T-Theory, that would cement a new T. In my personal view of T-Theory (which adds the McOsci), we have McOsci higher lows since -83, followed by a higher high before retreating to the zero line. It is standard acceptance that the VO will retreat from new highs to the zero line after forming a new T. What is important is the reaction of Price to this move back to the zero line. (More on this shortly.)

Is it as strong as the T that began in March and lasted through April 5? Absolutely not. The VO has not gotten above the 100 level at this point.
Note that as the VO retreated in March, Price retreated with it after April 5. In a positive environment, Price should have continued higher even as the VO retreated.
Looking at the above unmarked chart, one can see that the last two tops in both the VO and McOsci were what I call “simple” formations, which are weaker and can form quick Price reversals. (This is part of my personal T-Theory concept.)

Where the above charts start to get interesting is based on the red descending line on the VO, and the similarly placed green one on the McOsci. We are at a time when a new T can form around the next low, and be confirmed after reaching above their respective last highs.
On a shorter term basis, we are reaching the climactic point on a short term Daily Companion chart which I’ve been posting since February:

And the Hourly chart has bounced off the red descending line which has held as support for the last two weeks:
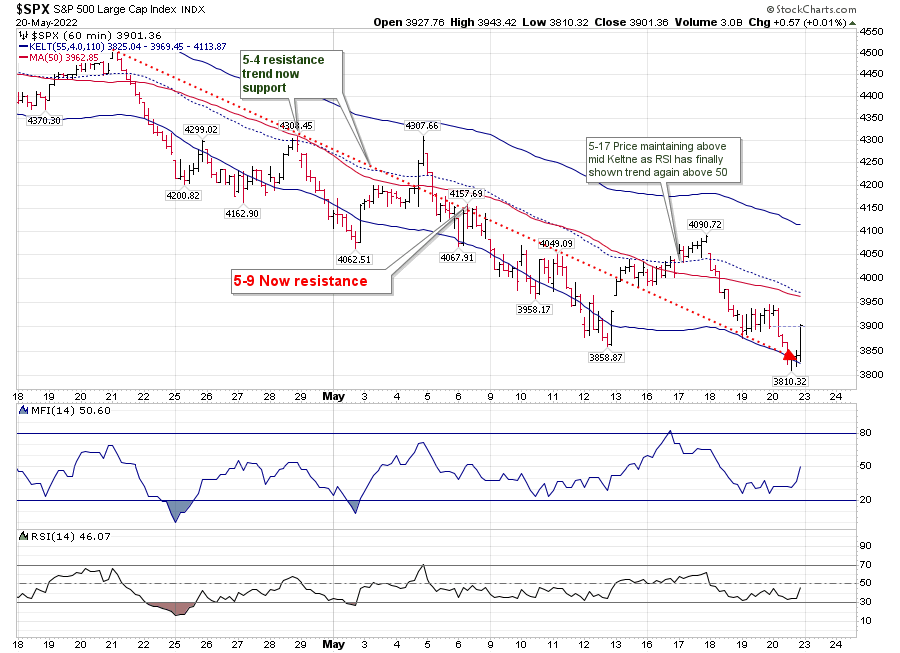
Both RSI and MFI are at their respective 50-ish points, and resolution should come shortly.
Personally, I have put investment funds to work at the close Thursday, based on the VO and McOsci shapes. That’s about 700 points lower than where I pulled these out of equities in April.
My “simple chart” is at a low that is similar to the 2018 bottom, but it is not approaching it with the same degree of velocity as it did then.

This recent move has created lower PMO tops since June of 2020, while Price continued to rise for many months after it hit below the zero line in the fourth quarter of 2020. Breadth momentum is attempting once more to break through in a positive fashion, while Volume momentum continues to show negative outcomes.
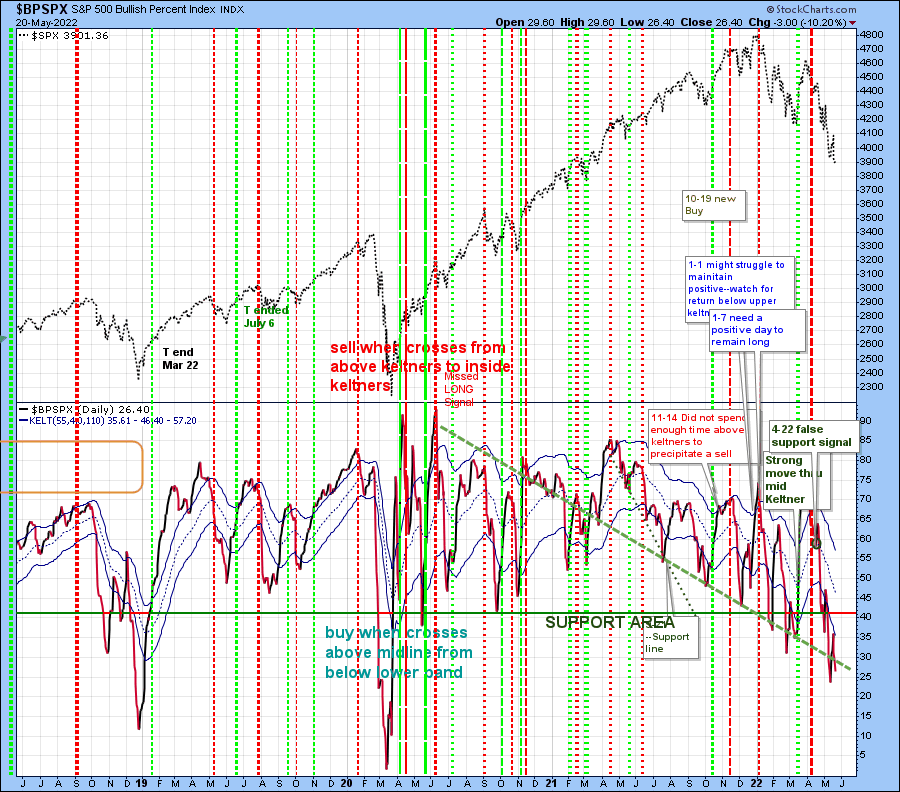
The Bullish percentage has slightly broken support, and has not reached the low it reached in 2018. That’s not supportive. And yet, it’s very close to the line I have drawn as support one year ago.
I am not expecting a T of great power at this point. In fact, it may just be one that floats minimally above the water line. I won’t hesitate to remove this from equities should I sense I’ve made a mistake.
***********************************************************************
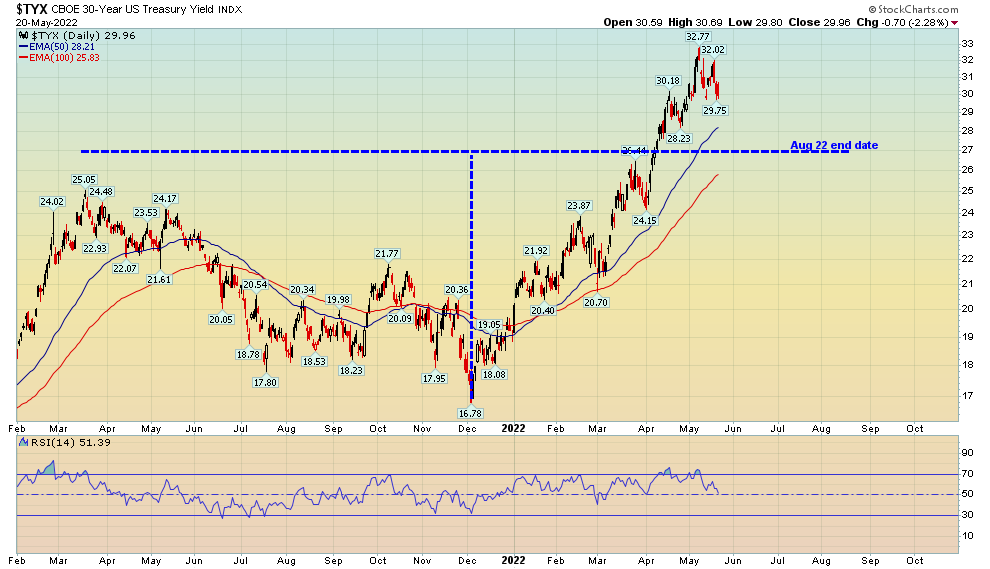
The TLT Inverse T is over.
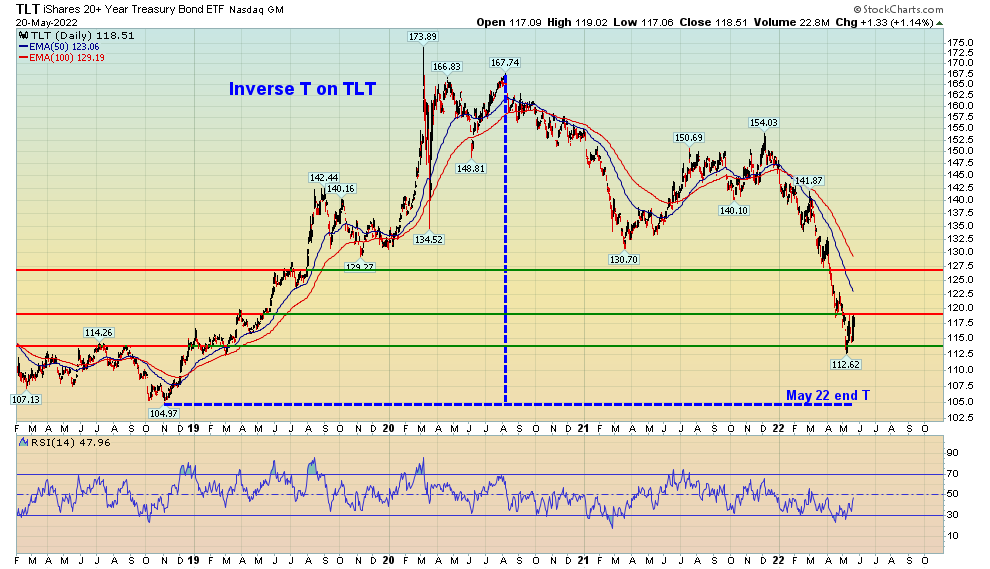
It may have ended 10 days ago at 112. This was a 3 year T, and if I misplaced the center post by 5 days, that would account for the 112 low 10 days earlier. This T was an experiment for me, and it exists within a larger 30 year T that extends through August.
The Inverse T brought TLT’s price lower, and in the opposite of a normal T, Price can now rise. (Instead of weakness at the end of a normal T, this can create the inverse.
But…
I wouldn’t be too sure it has anywhere to go until the August end of the 30 Year T.
Stay safe.
