Problems Analyzing The Move Higher

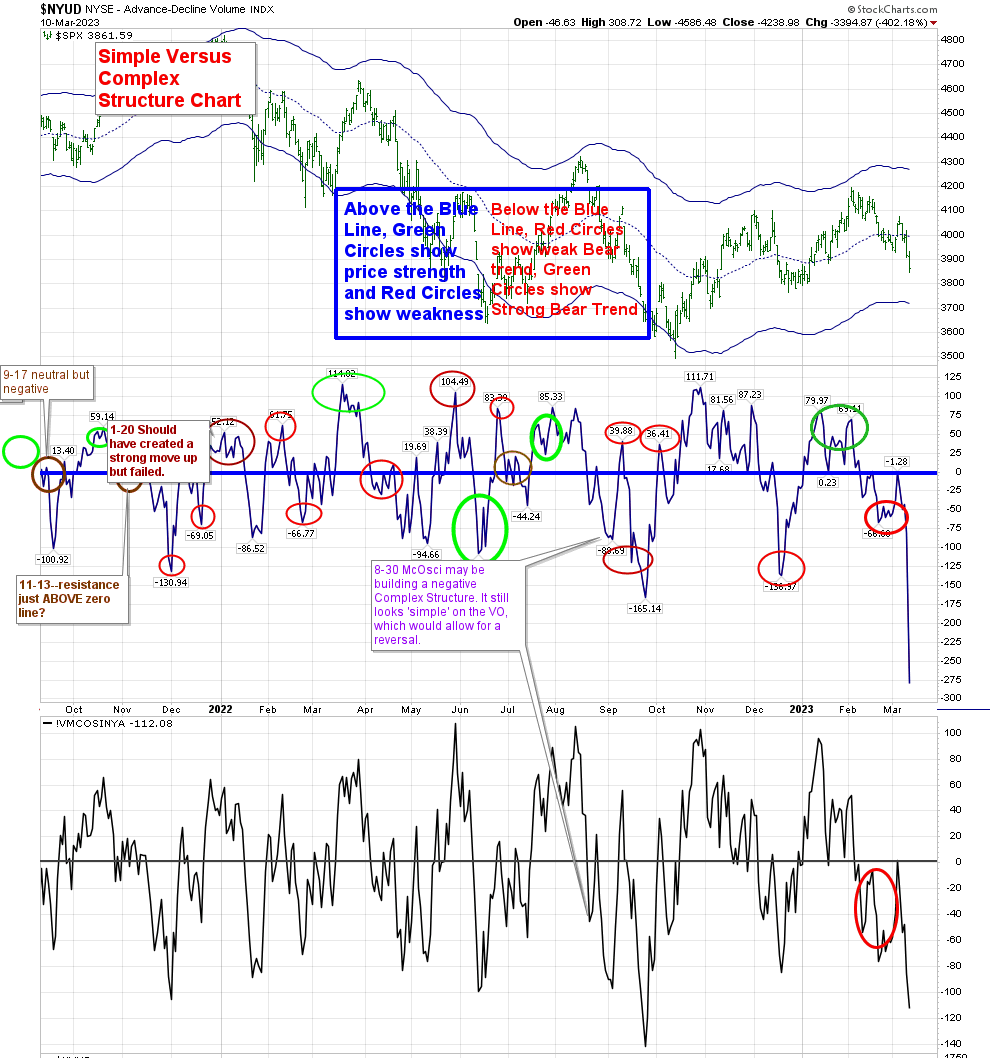
Looking at the T-Theory unmarked chart, I could put in a T that will last through May 13. I should put it on the 2023 chart. I was looking for a bottom to begin sometime in the second half of March, and it appears that we have one as per the chart.

What’s stopping me? For one, the red circled areas on the McOsci. It’s very rare for a T to form in this manner. In fact I’ve never seen this formation before. But what it means to me is that the MACD of the Up/Down Volume was stopped at a neutral reading. Price received a spike low on March 13, but the VO and McOsci low didn’t come until March 17. What we should have received after both the Price low and the VO (and McOsci) low was a distinct move higher through the zero line, creating a new T. The crossing of the zero line didn’t occur until Tuesday, March 28.

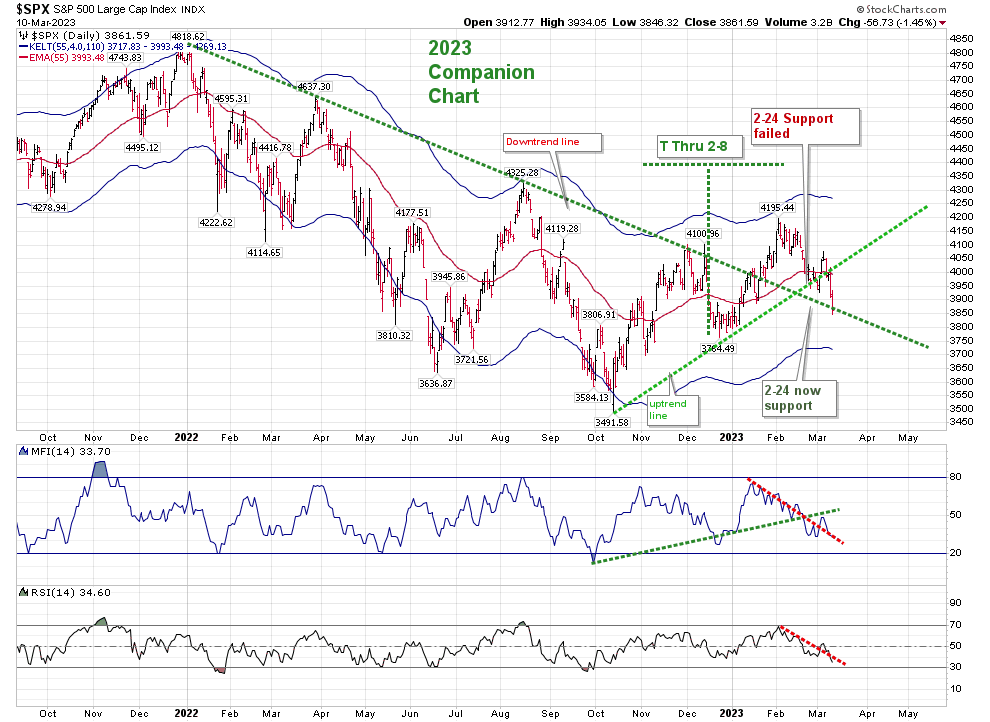
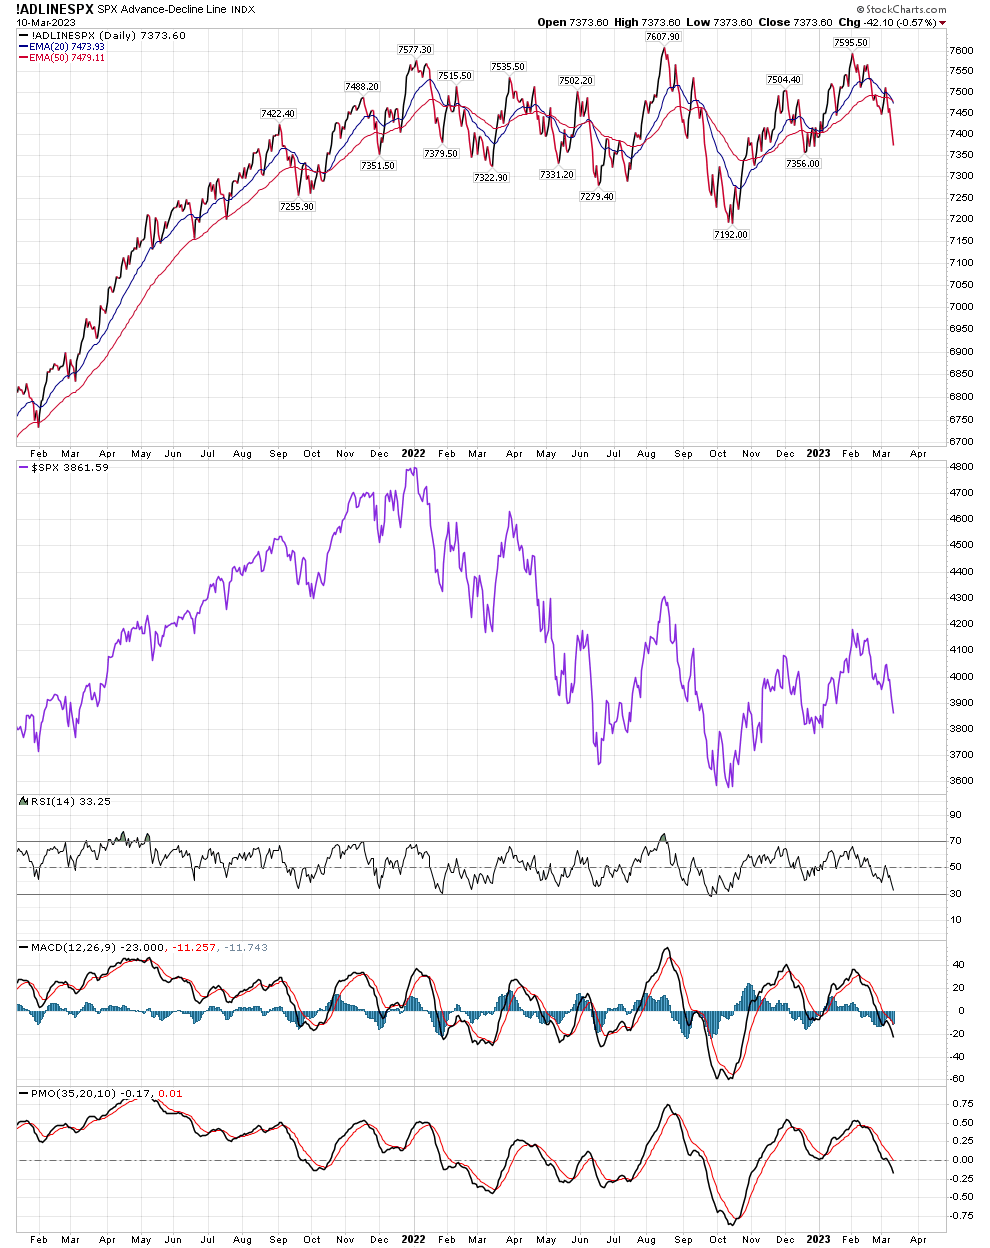
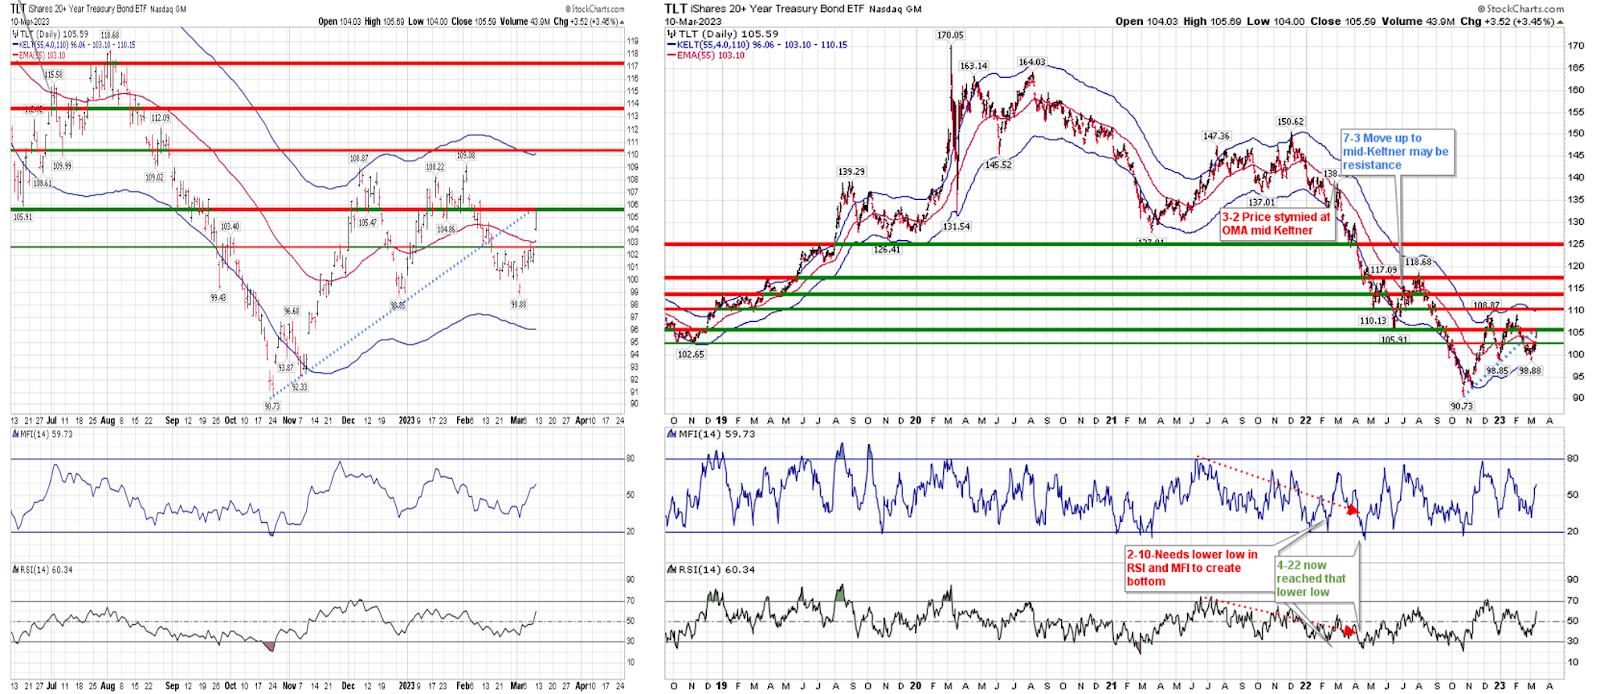
On the Companion chart, Price is reaching the red trend line which is resistance:

We have come through resistance on the MFI and the resistance at the 50 RSI. That has to be admitted.

The hourly chart is reaching its upper boundaries, and is approaching oversold areas in both MFI and RSI.

But it must be noted that it has crossed through what I consider resistance, as per the red dashed line.

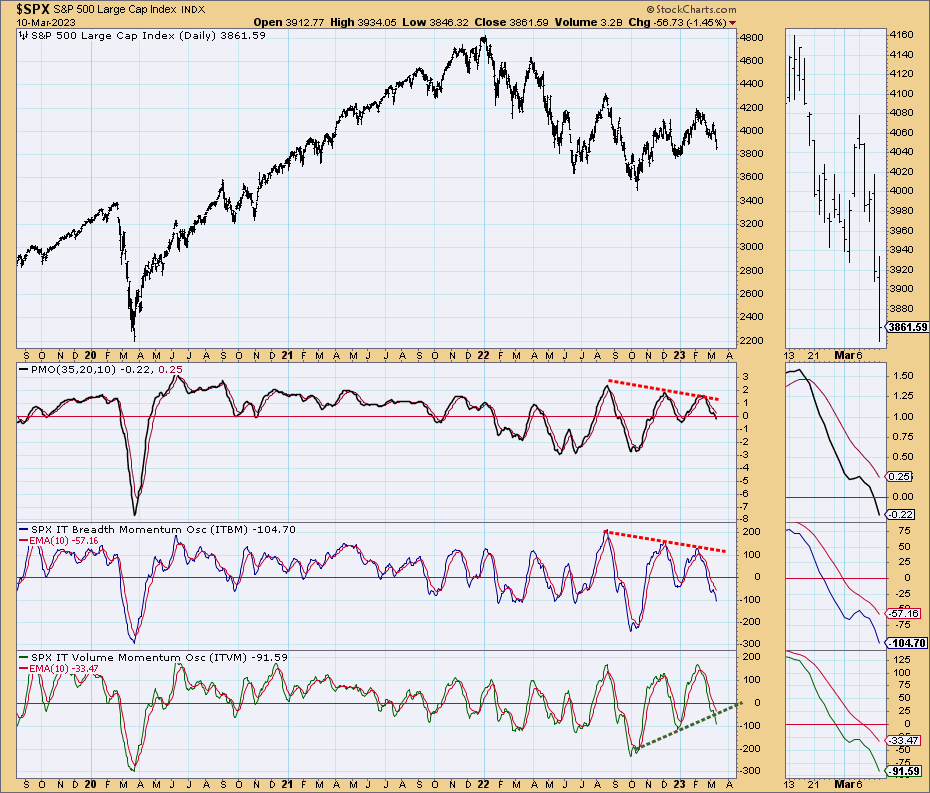
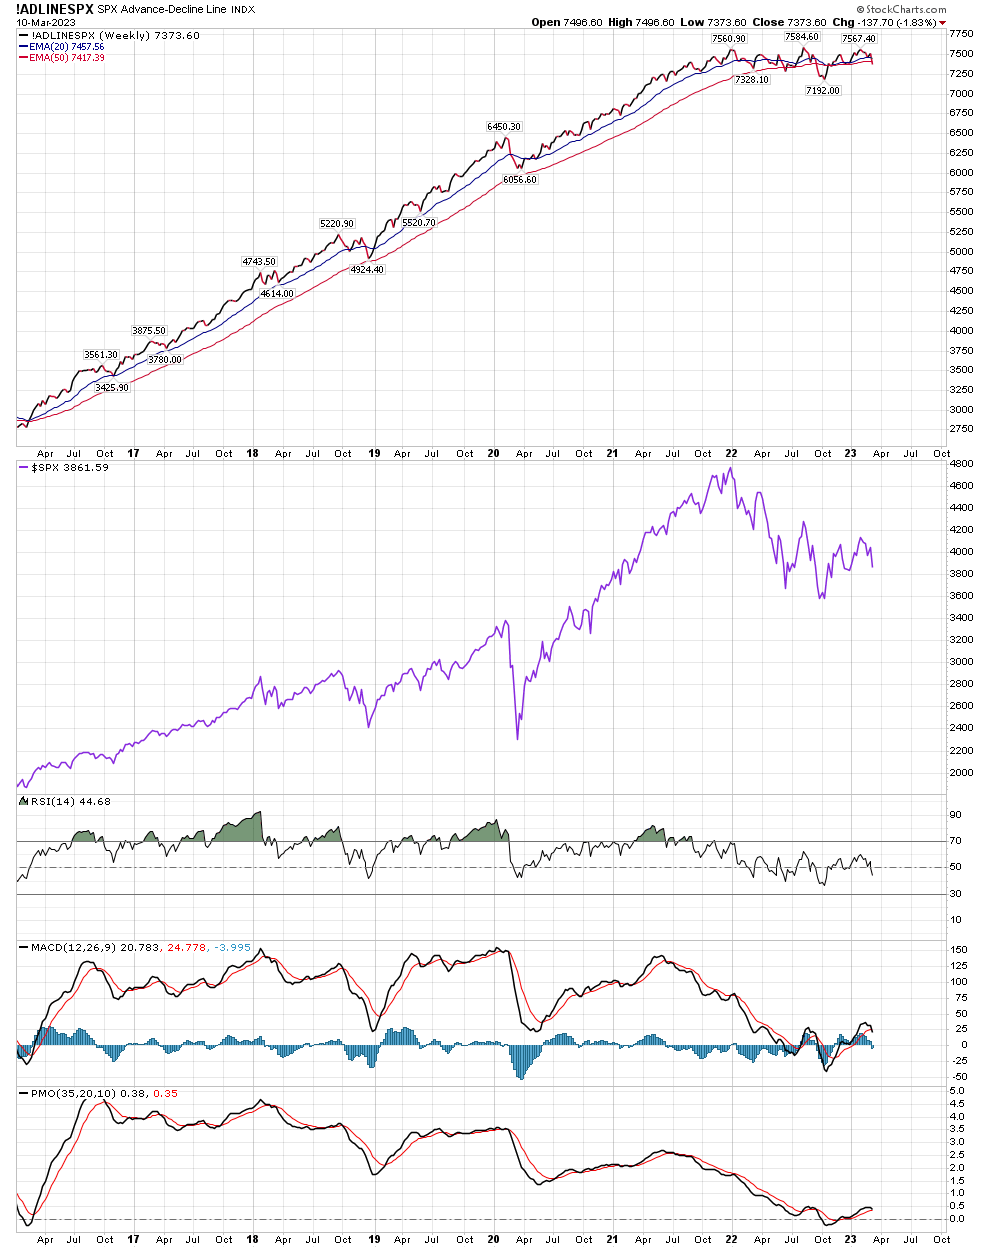
Looking at the larger picture, we have crossed just above what I consider the weekly Keltner mid-line. That chart also shows a point of recognition coming up, and it’s similar to the one on the daily chart which I mentioned in my previous post. Could it be the end of the downturn rather than a break down? Absolutely. But I suggest straddles for that event. Please note that RSI is at a critical point now.

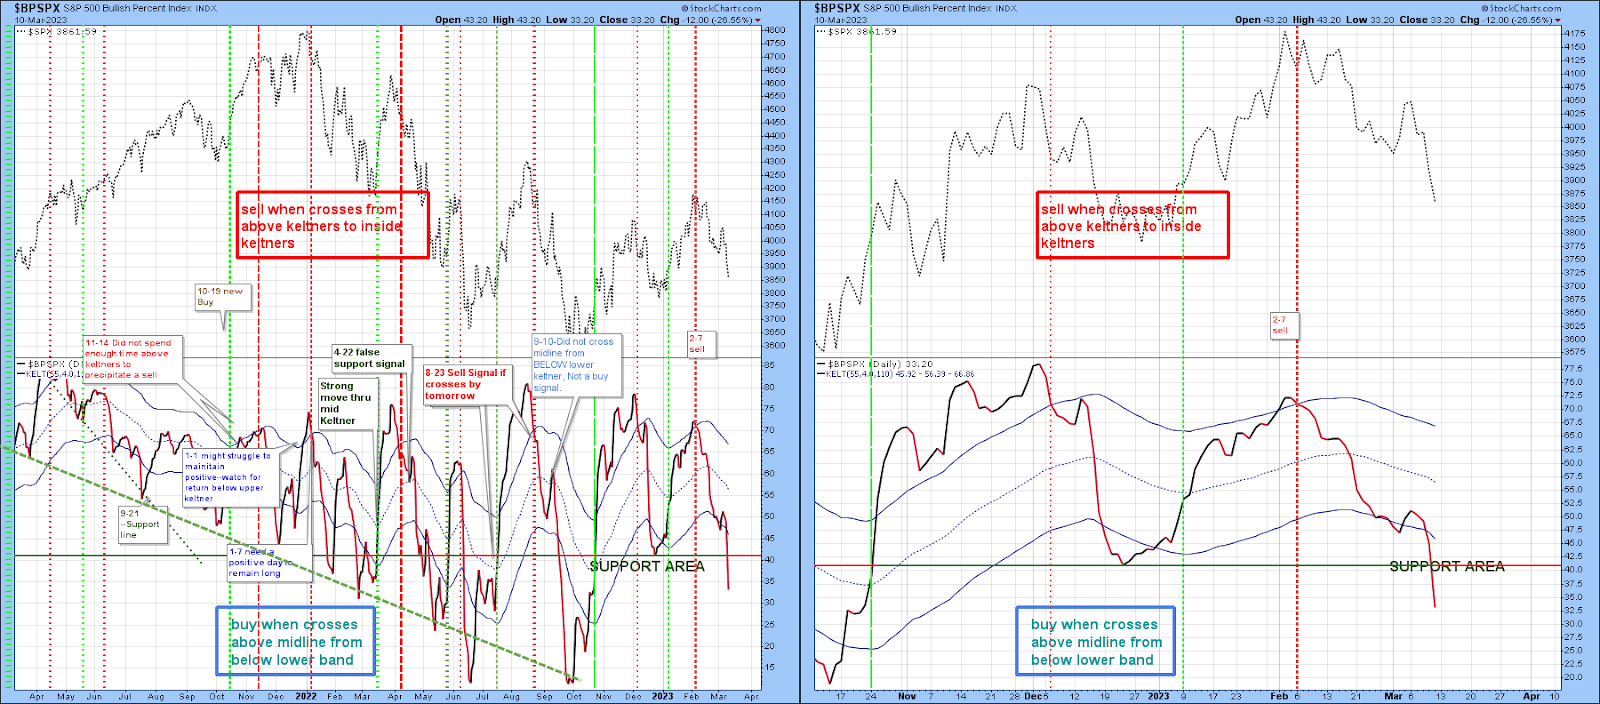
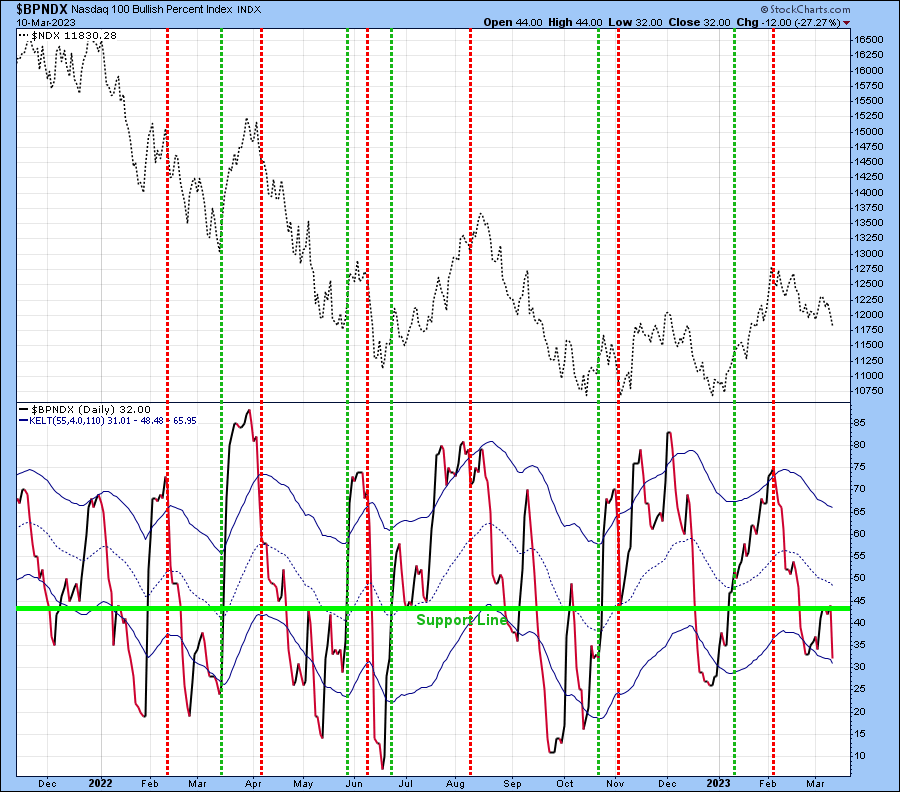
BPSPX has crossed above the lower Keltner band, and is making its way towards the mid-Keltner. But it hasn’t crossed yet. It did stop moving down at 25, which is severe support, and has made its way above 40, which has been used by me as support in longer term bull markets. I can’t unsee this chart–it is bullish, but not confirmed.

But what I also can’t “unsee” is the Simple Chart. While it has turned up, it has still not crossed the zero line in either Breadth Momentum or Volume Momentum. While it doesn’t mean that it won’t, based on how Price is acting over the last few weeks, this has struggled to build momentum.

The Simple and Complex Structure Chart was annotated on March 19 as creating a Simple bottom, which meant a reversal higher. But that low was not followed by a commensurate move above the zero line quickly. (Remember, this is a different way of looking at the main T-Theory chart.)

So I am skeptical. I may not be right. But I will not be wrong– for me. I will not kick myself for not using investment funds for this move. I may have traded it short term, but I can’t endorse it.

As for what is happening now in the market, we are at the end of the quarter. The last 3 days of a month have a significant history of moving higher more than 2% due to pension funds being forced to put money to work. I should note that today is T-1.

The link to the article (written in 2014 but updated in 2019) can be found here:

https://papers.ssrn.com/sol3/papers.cfm?abstract_id=2528692

Of course, there are opposing forces to this monthly move. When the market moves higher by less than that percentage, one should wonder who is selling into that. Sometimes it faces arbitrage, and is traded against. I hope I am not sounding like a tin foil hatter. There are always different forces at work in creating Price. And Price has been moving higher. But I am willing to wait to participate in this market, as we seem to be approaching an important point in 2 weeks.

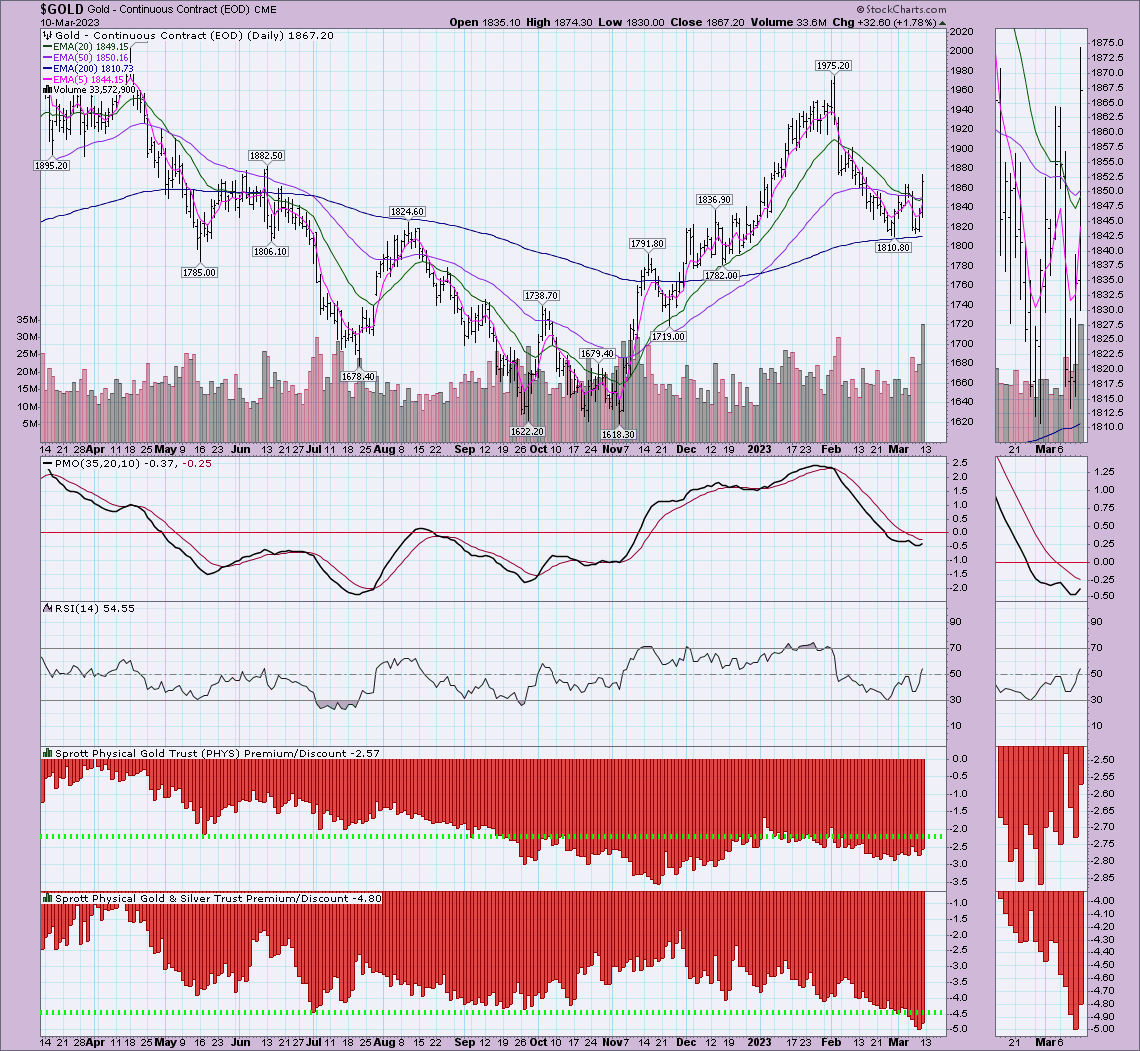
In other news, USO and GLD seem to be following a path higher.

No Post This Weekend

Please check the charts for updated information, as the charts in the menu are live charts, with notes.

One thing to point out is the end of an hourly Price T in GLD, within the possibility of a longer term T lasting through May. Those charts are added to the menu.

Moving Along

Some people like to say that the market is just evil and that it tends to do exactly what most people are not expecting it to do. I’m not a believer in that thesis. A simple look at history can put that idea to bed–people invest in the market to see positive returns, and over the last 90+ year the market has averaged a return of about 6.9%. Has the market gone up precisely 6.9% every year? No. But people don’t put their money in equities to lose money. And over time they have been right to do so. When it comes to our desires, fear and greed still rule over Price. There are times when we feel one stronger than the other, and there are times when we feel both at the same time. These latter times are where immediate Future Price becomes harder to discern, and that is where we find ourselves today.

Sentiment is a big driver in Price. The present Price encompasses the history of that sentiment, and its present Price is based on Past History plus “Present Expectations for the Future”. As a chartist, I try to formulate where we are going based on what Price and assorted technical indicators are telling me. But just like a work of art can be praised or distained based on the eyes of the beholder, we can only use our own view to make personal decisions with our savings and investments. There are those who prefer to let others make those decisions for them, but I have to assume that those reading this site use the information I present to help them come to their own investment conclusions, rather than rely on an charts and ideas offered by an anonymous figure on the web.

Since last week, the SPX and TLT have moved higher by about 1.4%, and the NDX has moved up almost 6%. That’s an amazing discrepancy. Gold has moved up almost the exact same percentage as NDX, while Bitcoin has moved up about 35% in the last 5 trading days. These are amazing numbers for such a tumultuous week. There has definitely been a shift in asset allocation, and the fundamental concept of fear and greed. While it’s something to think about, I’ll leave it to others to follow the bread crumbs. I haven’t investigated the Volume behind these moves, and that is an important factor. We’ll go back to “Just the Facts”, as posted last week.

Since last week’s entry, Price has moved higher, coming just up to the 55 EMA, which is the middle of the Keltner Bands on the T-Theory master chart. We are moving closer to that 50 RSI number, which is additional resistance. But with the low this week we have three higher lows since October, and it can’t be ruled out that in time we will break through the middle Keltner and at least try to hit 4100 again. Having said that, should we turn down Monday, the descending peaks in MFI and RSI will remain in a downward pressure on Price, while still searching for a possible T formation shortly.

While the Volume Oscillator’s ability to show Present Value has been reduced by the way it’s derived on Stockcharts, it still seems to give me a good idea as to when to expect the next T. For a few reasons we could be anywhere from a week to a month before we see that T. The McOscillator was stopped right at the trend line of lower lows I have been showing on the main T-Theory chart.

While it may appear that I am drawing that straight red line through the top of 1.57 that occurred in early March, I should point out that sometimes Terry Laundry would take the same discretionary pencil to his chart. But we can see that the VO doesn’t have this discrepancy, and that’s my rationale. One reason I am expecting the T to begin later has to do with where the VO descending tops hits the -100 line. I normally expect the T to begin where the VO crosses the zero line. (That almost occurred at the beginning of March, but it failed.) But in this environment, the next stop I would look for is that -100 line. (I should remind my readers that in 2018, I had no T’s on the long term chart, and only dealt with shorter trading T’s and TLT.)

The Shorter Term Companion Chart has some new notes on it. I’ve added a trend line from the 2020 low through the Ocotober bottom, and it points to a Point of Recognition in mid-April. These points of recognition have been noted on my site 3-4 times over the last few years, and each one has led to a 3% move when completed (although direction is unclear–straddles can be used successfully). We will have to see if Price stays inside the small window shown between the red resistance and green support areas over the next few weeks. RSI and MFI haven’t broken through their downtrends. Sentiment seems to be very bearish, but Price doesn’t seem to want to break down any where near the daily lower Keltner band number of 3701.

I’d like to show you the hourly chart next, but there is a large discrepancy in Stockchart’s data that needs to be addressed. While the Daily chart shows the intra day low on Monday of 3808, the data for the first few hours of Monday’s trading on SPX is missing from the hourly chart. I’ll present the SPY chart instead:

MACD is either about to cross negative, or instead of crossing it will kiss and reverse. RSI is deadlocked at the 50 number, and MFI seems to be peaking. All of these characteristics can be seen on the hourly SPX chart on this site.

The Hourly Volume Oscillator chart does show an extreme low in Up/Down volume itself in the last hour of Friday’s trading, where we could expect a reversal higher in price, at least temporarily.

The bottom line is there is no visible T in SPX. My other charts offer no impetus to invest at this time.

BPSPX has turned up from a very low reading of 27. The lower band is at 41, which is where long term support lies. It’s been on a sell since February 7.

While I don’t write about it often, I do offer the NDX Bullish Percentage on my site. While the chart suggested a sell in early February, we have a failed peak in early March. We’ve now reached the same point on the BPNDX chart as we did at that March failure, but Price has significantly breached that early March high. But it still doesn’t offer a buy signal.

The ‘simple chart’ shows the possibility of a reversal of Breadth and Volume momentum. While these are not hugely oversold, they are oversold enough to create a rally in Price, and beginning to turn upwards.

We had a 1% move in TLT, but this move was less than the move in shorter term bond ETF’s. IEF was up 1.9% and IEI was up 1.88%. The movement in rates on the lower end of the maturity curve were much greater than on the 30 year, but duration lessened the effect on Price, even with these large increases. What we have seen is the shorter maturities move lower in rates as we expect a recession to hit sooner rather than later.I still expect TLT’s movement to be rangebound. The movement over this month can be seen on the chart:

While I am still looking for TLT to be rangebound, the tide is finally beginning to shift on the long term chart I follow:

Looking at the MACD on the bottom of this chart, it is finally starting to turn up to where long term rates can begin a move lower for a period of months, instead of the quick volatile moves that we’ve had both up and down.

This has also made the Confidence Index move lower by about 10 points. Are we close to where we have normally been prior to January 22? No. We still have another 10 points to fall. Is the system going to support these low corporate borrowing rates as we possibly move into a recession? I can only watch the charts for that answer.

For those who look at my charts on my site, I’ve added a chart for WTIC. It seems to be in an area where it should at least bounce. Here is the corresponding USO chart, although based on the tax structure of USO it’s not something I personally would trade in retirement accounts:

I’m kicking myself for only taking a short term flyer on GLD. But we have quickly approached overbought territory. That being said, it could be possible that we have a T through early June, with a short correction coming soon for redeployment.

Just the Facts

I have been guilty over the last few months–since October, really–of looking for Positive Outcomes. I’ve used some analogies that I regret–-Lucy Brown, for example–but I have to admit that having survived multiple crises, I’ve come to believe that we do persevere. I won’t give up that idea, even if I have to wait longer for the outcome I desire. Please remember that in addition to being a site about T-Theory, it also represents my personal journal on investing and trading. 

The following chart was offered in my last post (February 24), and I have marked Price movement since then in blue.

While I began early March by questioning my belief that a better low would be found later in the month, Price and basic technicals have confirmed my thesis. 

Since the beginning of the year, SPX is up 0.58%, IWM is up 1.04%, and TLT is up 6.59%. The 30 year bond is 3.65%, down from 3.88% at the beginning of the year. GLD is up 2.49%, and GDX is down 5%, as is XLE. 

Since my last post, SPX is down 3.7%, IWM is down 6.9%, TLT is up 3.4%. GLD is up 2.5%, GDX is down 0.4%, and XLE is down 2.5%

These are the asset classes I look at, as T-Theory looks for the creation of T’s in all of them. T’s look to put money to work, not short an asset class.  I have been laddered in short term treasuries for the most part of last year, with minor exceptions. It’s been frustrating, although it has been minimally rewarding. We had lots of positive T’s since April of 2020 including some longer ones in 2021, and keeping my full investment funds out of equities most of last year was a difficult decision. The T that ended on November 8 ended at 3860. The T that ended February 8 ended at 4117. And here we are back at 3860.

As shown on the main T-Theory chart, we are now at a point where a new T can begin at any time.

We have a lower low on the McOsci, and most probably a lower low will show Monday on the VO. That being said, this is an environment where I am willing to miss the centerpoint of the low, even though it is usually where most of the gains are made. This environment is too volatile, and the low is still not as deep on the McOscillator as it was in October. Perhaps we are just a few days away from that. But what I have found in the past is that the T’s center point may arrive when the dashed blue line of descending peaks on the VO crosses the -100 line if it fails to do so when it crosses the zero line. It is the next line of support in Time. And that looks to be closer to the end of the month.


We have reached the point where I expected support to exist on the Companion chart, as marked on the downtrend line from January 2022. But RSI and MFI can still go a bit lower to confirm a bottom, and thus I still wait.

The hourly companion chart is bumping against a low in RSI, but so far it hasn’t begun to rise, and MACD hasn’t turned either. I usually like to see a matching oversold or overbought situation in MFI to go with one in RSI, as we had on March 6.

The hourly NY Up/Down Volume oscillator chart is at an extreme low, at a point where we usually see a relief rally.

But other indicators are still negative.

The BPSPX is now below a major support area, down 12 points on Friday to 33.

The Simple chart is still showing negative momentum in Breadth and Volume, just as it did at the end of February:

As pointed out on the Simple/Complex chart, we have built a negative complex situation, which precludes a V shaped Price bottom.

I’ve added a Bullish percent chart for NDX, which is also negative.

Of major concern we have the daily Advance/Decline line below both the 50 and 20 EMA, and in fact, the 20 EMA has moved below the 50.

It also appears that A/D line on a weekly basis is below the 20 and 50 EMA

I did take a flier on GLD using options earlier this week based on the discount to NAV, however I closed it yesterday, perhaps prematurely, but I have a cyclical low in due July:

We have an interesting situation in rates. While many are invested in long term bonds via TLT, it is the 2 year rates and longer which have been  most affected by the recent banking turmoil:

As can be seen, the 2 year rate is down about 30 basis points since March 1, with a similar move in the 30 year.  The 2 year began 2023 at 4.4%, and the 30 at 3.88%–which was the 30 year rate on March 8 & 9. Just an observation, which I will leave to others to pontificate.

TLT is the 20+ year ETF that many including myself use and track. I don’t have a T in it, and to get one I would need to pass resistance at 110. That’s about 5% from where we are today. I would like to have less space between today’s price and a T, but that’s not what my chart shows me.

As the short term chart on the left shows, we are at what should be resistance based on what I show as a long term line dating back to 2019 on the accompanying chart, but in truth I have that as resistance as far back as 2012. I should note that this chart is adjusted for dividends, which means it may be considered inaccurate by purists.

My hesitation for calling a long term T lasting 2 years in TLT is my conservative nature, and this chart:

I need to see the weekly MACD cross to have good feelings for TLT or USB. Those crosses are usually good for multi year T’s. Keep in mind that the price on the upper part of the chart is not for USB, but for TYX, which is the 30 year rate. Its scale can be found on the left side of the chart. The MACD is for USB, and the Price of TLT does not include dividend reduction. That is why it shows _TLT rather than TLT without the underlining dash.

Let’s hope we have the opportunity soon to invest in some T’s.