Well, a week has passed. SPX does not look like its moved much. Thursday’s move created a price low, but was inconclusive for a Volume Oscillator bottom. My note of June 24 suggested that the VO would peak below the zero line, and since then it has begun a move lower.

The Companion Chart is showing us that price is still in a peaking period, and technicals are a bit overbought. In a bullish environment, I would look for 50 to hold on RSI and MFI.

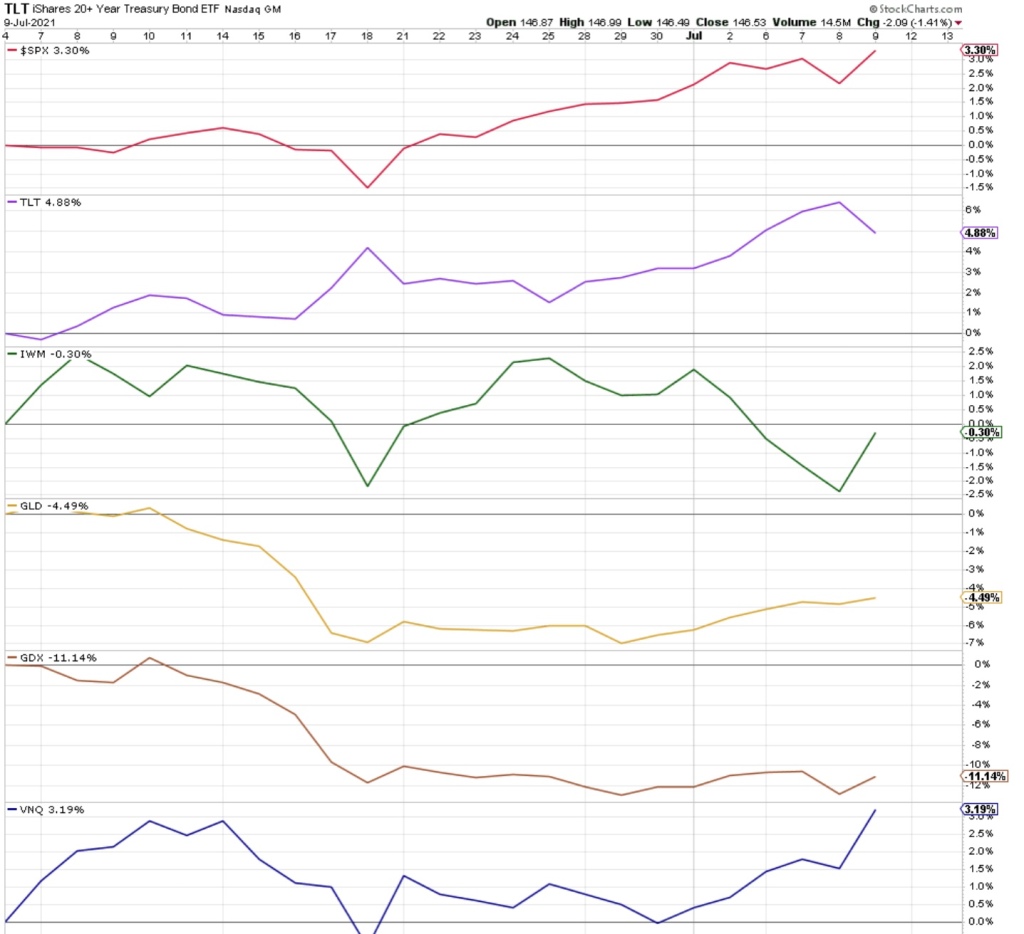
We are still in the best asset class since June 6, as this week SPX is up .5% and TLT is up 1%.
But we have issues in TLT. It moved above its upper Keltner band, and has since crossed under the upper band. I would expect it to tap the daily middle Keltner line on this reset. We’ve seen this in other assets before, as Terry Laundry called this “Frog Jumping” from one line to the next.

You can see another example of Frog Jumping in this Andrews PitchFork chart of the 30 and 5 year bonds that I’ve been tracking for the last 10 years:

Getting back to TLT, using standard Keltner bands (rather than Terry Laundry’s equity Keltner bands), 144 should hold instead of 142, as shown above.

Looking at a weekly chart, the damage needs to stop above 144. I would protect profits below this.

With US bond sales coming this week as well as bank earnings, the catalysts are clear.
