“There is time to go long, time to go short and time to go fishing”
The above quote is from Jesse Livermore. Those who spend more time than we should on the market are somewhat familiar with that name. He rose to prominence as a great speculator (I think that is what he considered himself to be), but also as someone who made and lost fortunes along the way, until his suicide in 1940.
When you invest (rather than speculate) based on Time Symmetry, it’s important to know when to get on and off the train. Magic T Theory–no matter how strange the name may sound–allows you to invest within boundaries divided by support of time and price. Utilizing any form of this concept allows you to open your investments close to bottoms, and advises you when it is prudent to remove risk from your portfolio. There’s enough information within the T-Theory Concepts page on this site to get you started if you have not begun this journey before.
The present chart for T-Theory is as follows:
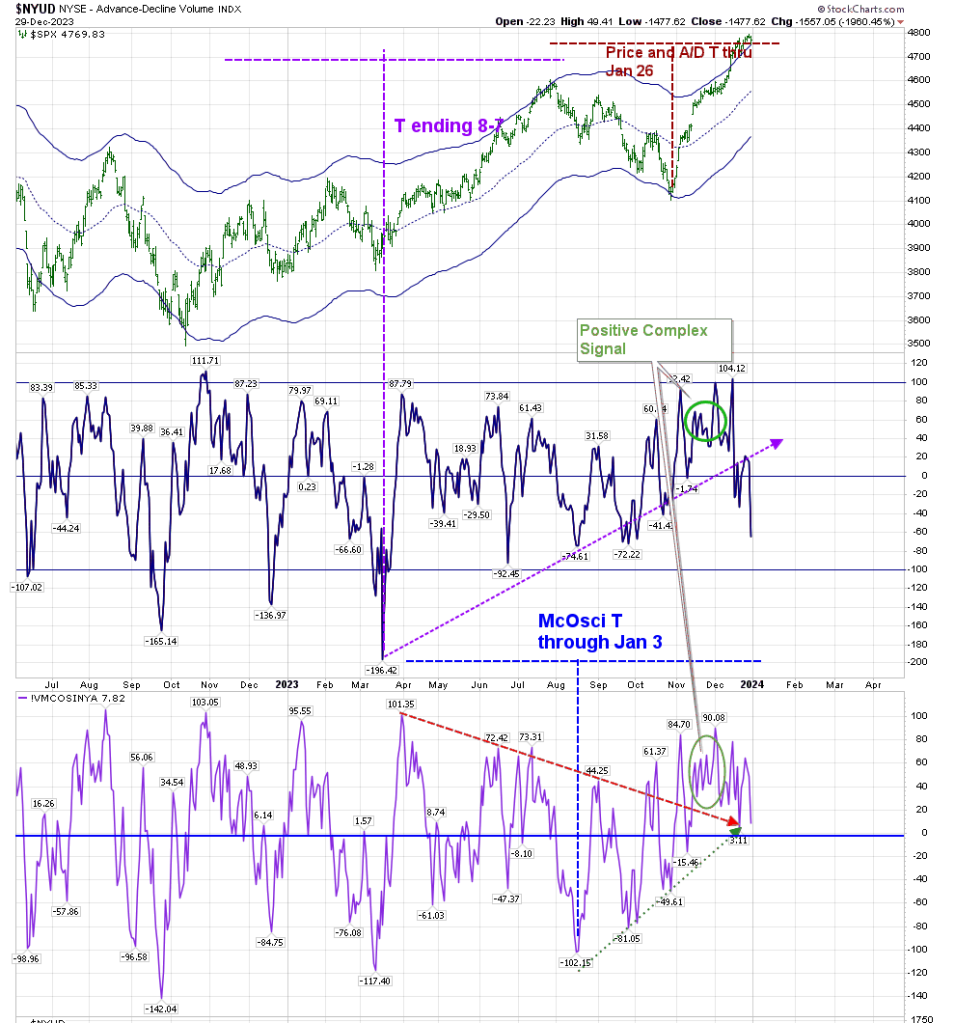
I’ve removed earlier information from it in order to concentrate on the present state of the chart. We have a McOsci T that ends next Wednesday. It should show us some weakness in the market, but it doesn’t have to do that. The end of a T doesn’t always mean an end to higher prices; it means that it will stop showing excessive strength. Some T’s end in a muted continued advance, while others show a plunge, and still others have a minor move back to support. We do have additional evidence moving forward.
There is no Volume Oscillator T. The last of these ended August 7. It did produce a turndown in Price. It was validated by my personal tools of the Advance/Decline chart, the BPSPX chart, and the “Simple” chart. None of these has yet confirmed a Price top. They are still in Buy mode. What the VO tells us now is that there is some selling going on over the last few days–enough to finally bring the VO below the zero line, and forming some type of resistance at the advancing purple line. This could be in concert with the end of the McOsci T.
But that doesn’t negate the further positive role of both the Price T and Advance/Decline T that end in late January. The Price T is shown on the above chart, and the A/D chart follows:

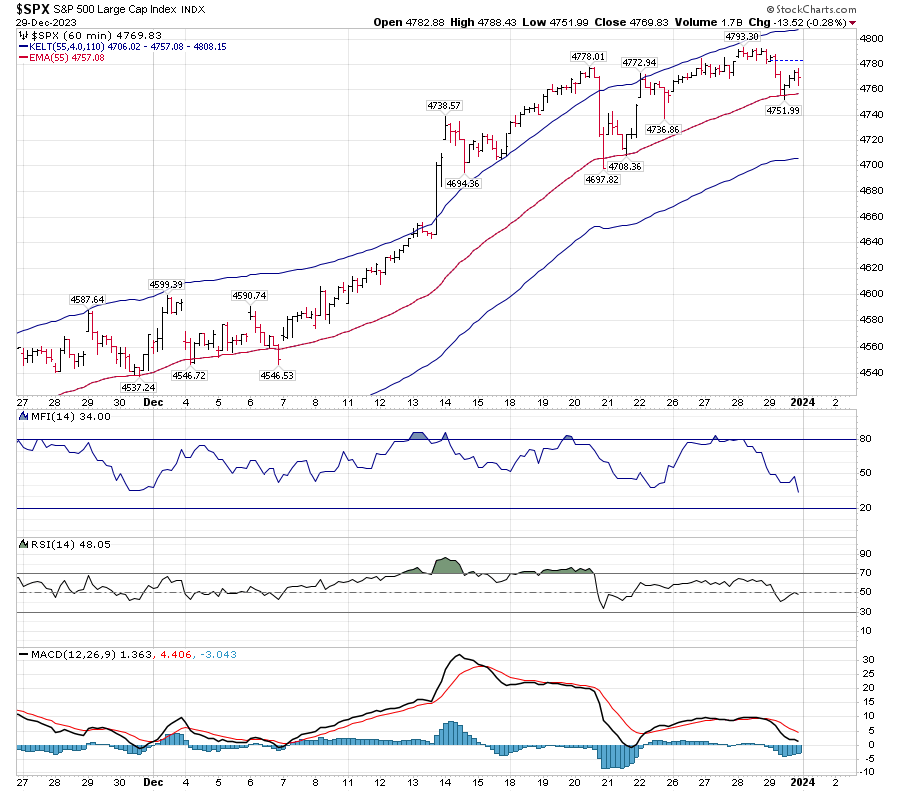
The Daily Companion chart shows Price is remaining above the upper Keltner band, even through yesterday’s downward thrust. Price stopped moving down just above that upper Keltner. That is initial daily support, with the middle Keltner band lying at 4560, about 4% below today’s closing price.

The Hourly Price can give us some closer stops. The Hourly Companion chart shows Price movement has been bouncing off the middle Keltner band. Hourly support is 4758, followed by 4706.
“To anticipate the market is to gamble. To be patient and react only when the market gives the signal is to speculate.”
Jesse Livermore
Go fishing. Wait for a nibble before assuming it’s time to change tactics.

Really enjoy your emails and the new site. Thank you for sharing your thoughts. Great call with the McCosci T. The tragedy of Terry Laundry was the lack of a successor. Paula would be wise to let you take over.
Rick
LikeLike