The site’s been closed for a while, and at this point I have only re-opened the Posts Page and the T-Theory Concepts Page. As we are nearing the end of this year, I thought I would submit this post for those who have been part of the journey for the last 3 years.
Those who are subscribers to elliottwavetrader.net know that on November 26, I posted the appearance of a McOsci T that is slated to last until the first week of January. The post also referenced an Advance/Decline T and a Price T. Both of those have ending dates around the last week of January. In order to make the situation clear, I’ve put all the present T’s on the following chart:
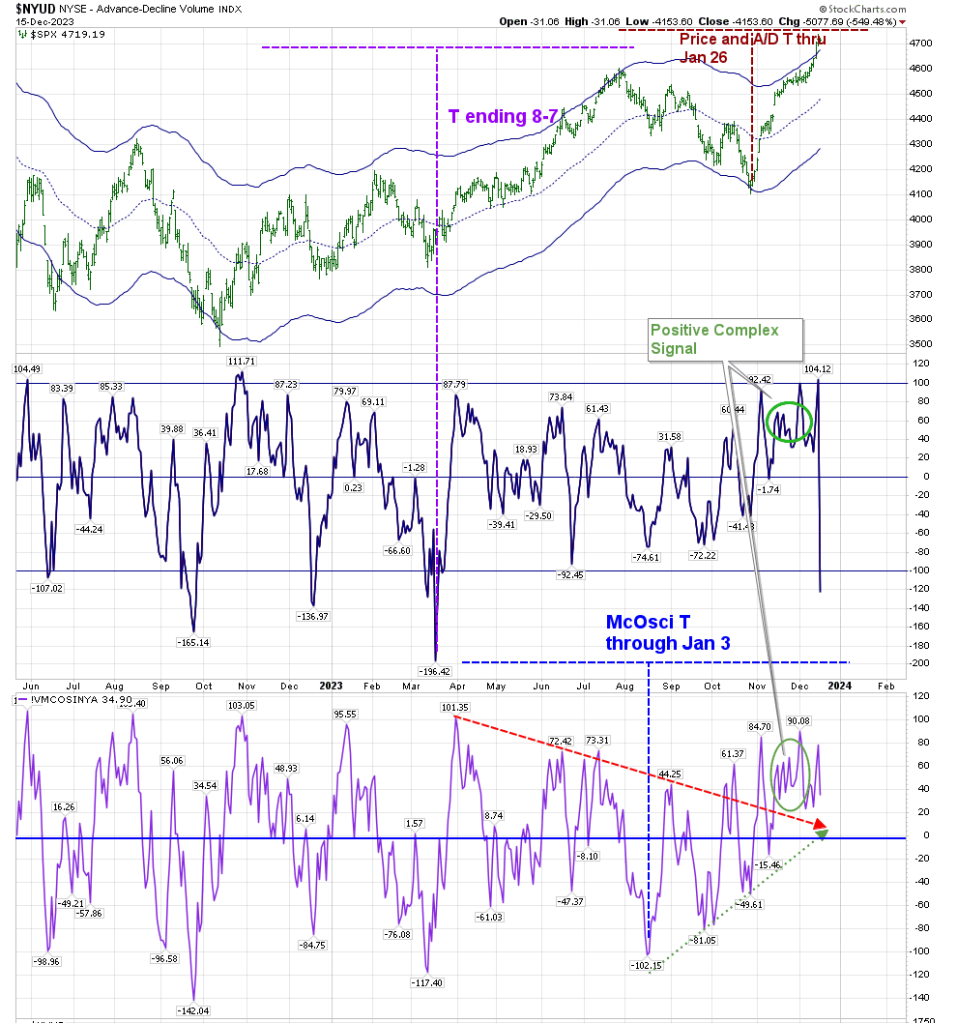
The chart also shows the Positive Complex Signal we received at the beginning of November. It corresponds to the Zweig Thrust signal which occurred at the same time. I’ve explained in the past that Complex signals suggest a continuation of a move–higher or lower. In this case that move has been higher.
T’s are periods of additional strength, and should be taken advantage of. But there is one troubling item on the above chart, and that is the Point of Recognition which occurs sometime during next week. These PoR’s are not part of T Theory. They are my personal construct based on the “art” of time symmetry. One may or may not consider them important. I do.
And that leads me to a discussion of a more troubling situation I see developing. It is partially based on a review of commodities. Oil has dropped to the low end of the envelope I use. Gold was in a similar situation (until this week), but held the important 180 level on GLD. When did Gold’s advance begin? On the day the Fed announced that it was most probable to start rate cuts next year.
Neither words nor correlation are the basis of my concern–it is based on what has happened to the Confidence Index created by Terry Laundry. Those subscribers to my posts here who are still members of Terry Laundry’s Forum may have seen my post on that site yesterday, linking to articles Terry made reviewing the importance of the Confidence Index. For copyright purposes, I won’t go into it deeper here.
This Confidence Index is based on the relationship between High Yield Bonds to Treasury Bonds. Simply stated, during risk-on times, the Price of High Yield bonds tends to rise more quickly than that of Treasuries. This causes the Index to rise. Yields fall when Bond Prices move higher. The Index becomes a product of Sentiment, as it reflects the faith (Confidence) of the bond market that risky loans will be able to be repaid easily as the economy expands. When the Index moves lower, it shows the removal of that confidence, as the yield spread widens between risky investments and lower risk investments such as Treasuries.
For the past 2 years I have been confused by the continued rise in this index. It has reached extremes that it hasn’t seen since –ever. The highest it reached was .95 in 1999.

And yet, after a precipitous fall from 1.25, it still is above that 1999 reading, sitting at 1.10. The Confidence Index shown above represents the spread between FAGIX (high yield bonds) and VUSTX (30-year Treasuries). It uses the same components used by Terry Laundry. Over the past two years, it has been more disconnected from the price of equities than at any other time I have observed it. There was an inherent faith that High Yield would in fact be a better bet than Treasuries. It’s my belief that the Fed and Treasury threw so much stimulus (ten times what they did during the Great Recession) into the market that inflation was inevitable. Was it better than the alternative of allowing the economy to collapse? My view is that it absolutely was. We were bound to face consequences from this extraordinary intervention. Giving everyone money–regardless of need–was excessive. Leaving rates as low as they were for so long was a mistake, and the pendulum has now swung the other way. Eventually we will reach equilibrium. The chart recently shows signs of Confidence fading. just as equity pricing seems to be whistling an all clear.
Back on July 2, I posted that I saw a confluence in the Confidence Index and in the Breadth Momentum (Simple) chart showing a Point of Recognition coming at the end of July, or early August.

That resulted in a drop of 500 SPX points, until the bottom was found on October 27. Please understand that I am not suggesting a similar situation now. As I pointed out above, these Points of Recognition are an “art”. They have kept me safe in the past. The “Halloween” formation I forecasted in November 2019 culminated at the end of January 2020 in the Pandemic drop, at which time I was not in equities. While others were feeling relief on reaching the highs of early 2022, I had an T scheduled to end that January which moved me out of equities for most of that year, with some short term exceptions.
There’s no certainty in life, and even more so, there’s only “art” involved in my concerns at the moment. It’s usually not a good idea to fight a T, or multiple T’s, as we now have. I don’t want to “think” about what is happening around me. I want to follow the charts. But at this stage of my life, I’m more concerned with capital preservation.
I am not invested in equities. I can miss the rally should it continue until the T’s end, fighting FOMO if I have to. I am sitting in Treasuries and bond ETFs with a maturity under 5 years. TLT has already reacted to a one point rate change by moving 16 points, while short term rates have not changed. What will change next–Long term Treasuries moving lower in rates, or Short term Treasuries attempting to confirm the movement of the longer end of the Treasury maturity table? I think the Fed answered this by revealing that it expects the short term rates (which are the only ones they control) to drop next year. The longer end has already priced those reductions into their analysis. ETF duration has already effectively reduced TLT’s potential until the shorter term ETFs catch up.
Speaking of bonds, the Five year rate T that was due to end November 10 ended a few days early, and the decline has been enormous since then. We’ve had a huge move lower since then.

The 30 year rate monthly MACD chart has not yet crossed into a positive mode, although it is sitting on that border:

TLT has crossed the middle Keltner on its weekly chart which is a positive, but it is now sitting in overbought territory on the Daily chart:


Happy Holidays, and see you next year. I don’t intend to post weekly- only when I see something that I’d like to point out. Right now, we are still in uptrends that should last a bit longer. But the concerns that I’ve stated above may become more prominent. In any event, it’s the end of the year, time to enjoy family ties.
Stay happy, and safe.

I wish you had posted that on your site here…i completely missed that important analysis. Appreciate your thoughts as always.
LikeLike
Excellent analysis – Very helpful.
Pat S.
LikeLike
A great holiday gift Bunker!
Happy holidays.
LikeLike
Bunker –
So nice to hear from you, sharing your personal and valuable insights with your fellow old and go slow followers. Most generous of you and also a way to keep alive both the memory and unique work of Terry. Best wishes for a wonderful holiday and a New Year filled with a bounty of good health. Keep up the wonderful work you do.
Bob Malik
LikeLike