
Last week felt like a terrible week for many market participants, and yesterday was the worst of the week. But on a weekly basis, there really wasn’t bad news for the general market. For the week, the Russell 5000 was up 1.3%, the non-weighted RSP was up .82%, and the weighted version of SPX was down by -0.57%. On the other side of the coin, the NDX was down almost 2%.
I made the fortunate case last week that the equal weighted version of the SP500 was exhibiting all the signs that a new T was created and that all of the positive T-Theory indicators I use suggested continued strength at least through the middle of November.
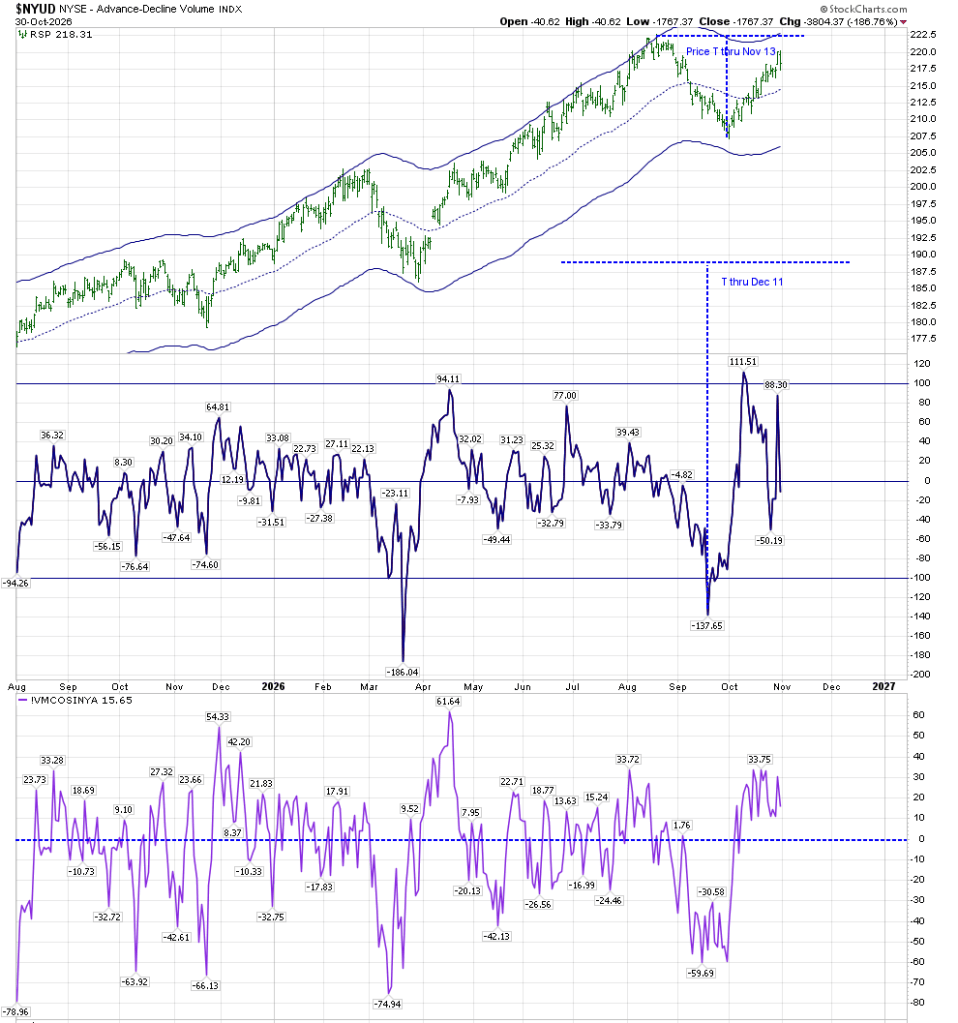
We can see how this has played out:
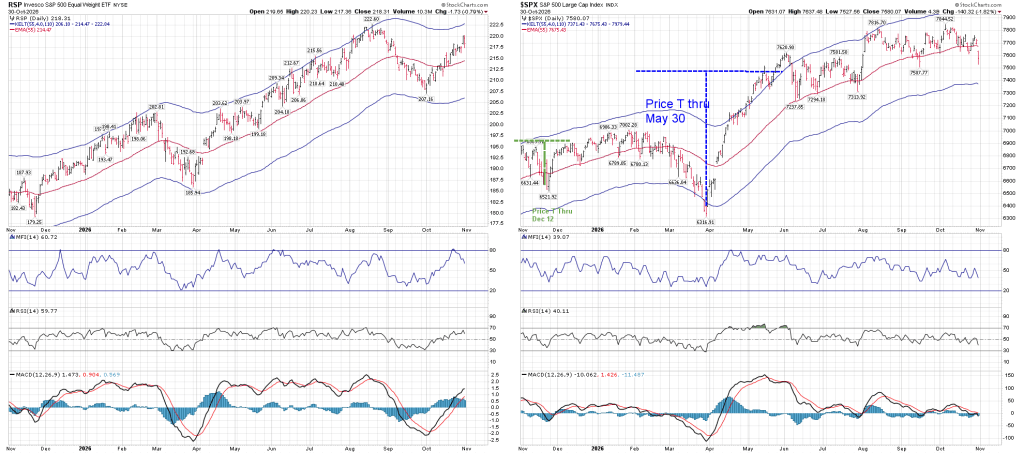
I’d like to put the above chart in context with a post I made in 2022, where I discussed an unconventional way of comparing Relative Strength:
That post was lengthy, and the pertinent part is found (unfortunately) near its end. The following represents its main point. It’s about a tool created by Parker Binion, who used to work with Terry Laundry at the T-Theory website. The formula for that tool is located in that post, but I offer it here. Here is how it looks regarding the RSP/SPY relationship:
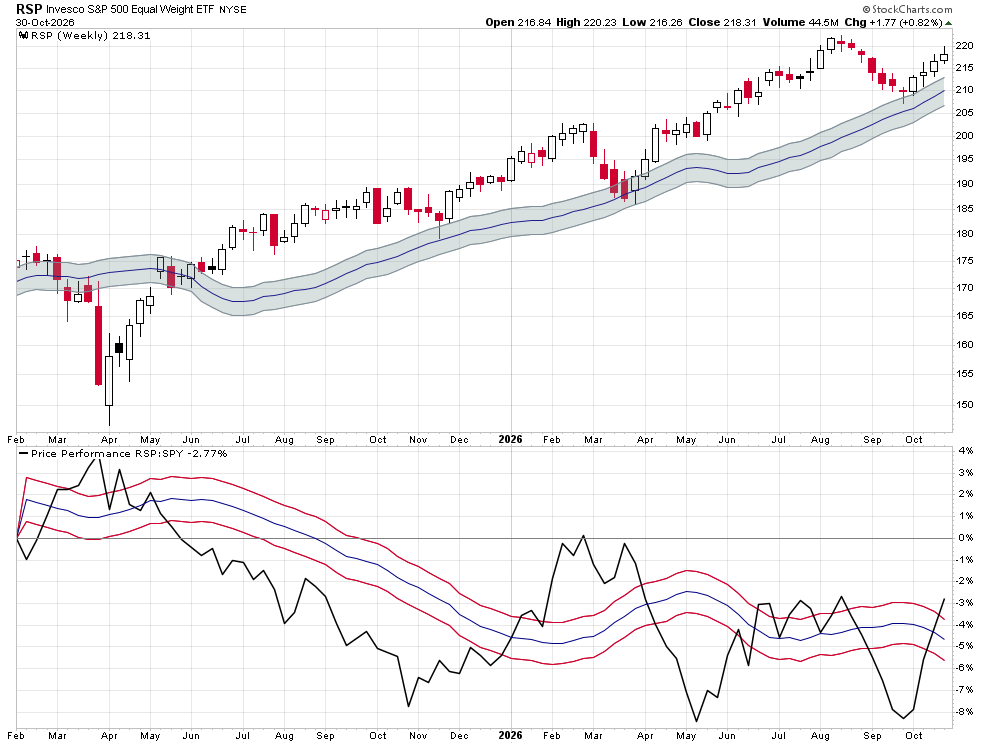
RSP’s Price (shown in the upper portion of the chart shows how it has remained above its standard EMA envelopes, which is a sign of strength. The lower portion of the chart shows RSP’s comparative Relative Strength versus SPY, and its Price Performance versus SPY.
For those who read my work on a regular basis, you’ll note that the present upswing in comparative relative strength (as shown in that lower portion of the chart) occurred at the end of September, which is the time frame during which I was expecting the creation of a new T (as per my posts on August 22 and October 1).
While I was able to capture some of the early October advance based on the low readings in all my indicators, I became uncomfortable with the manner in which SPX Price reacted when it ascended from its lows. After a strong initial response, Price failed to continue showing strength. It forced me to review my methodology, and I searched for a rational explanation as to why Price wasn’t reacting positively enough to what seemed an altogether positive environment. The answer was that the generals were retreating while the troops advanced. The BPSPX has moved up from a bearish reading (below 50) to 57. It even advanced during yesterday’s rout.
The main T-Theory Chart, based on SPX Volume Oscillator shows how the VO and McOsci refuse to move below the zero line:
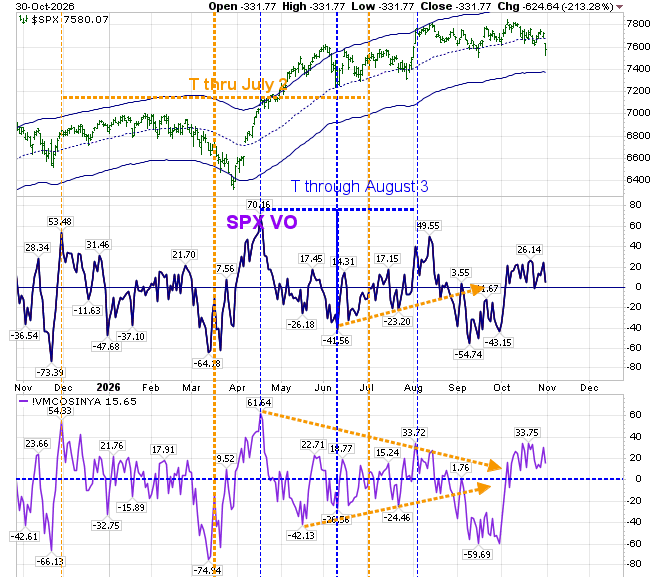
Price, on the other hand, has moved below the middle Keltner band, and may try to “frog jump” to its lower support. I am watching this on the RSP chart, which hasn’t broken down, as shown in the initial chart I posted.
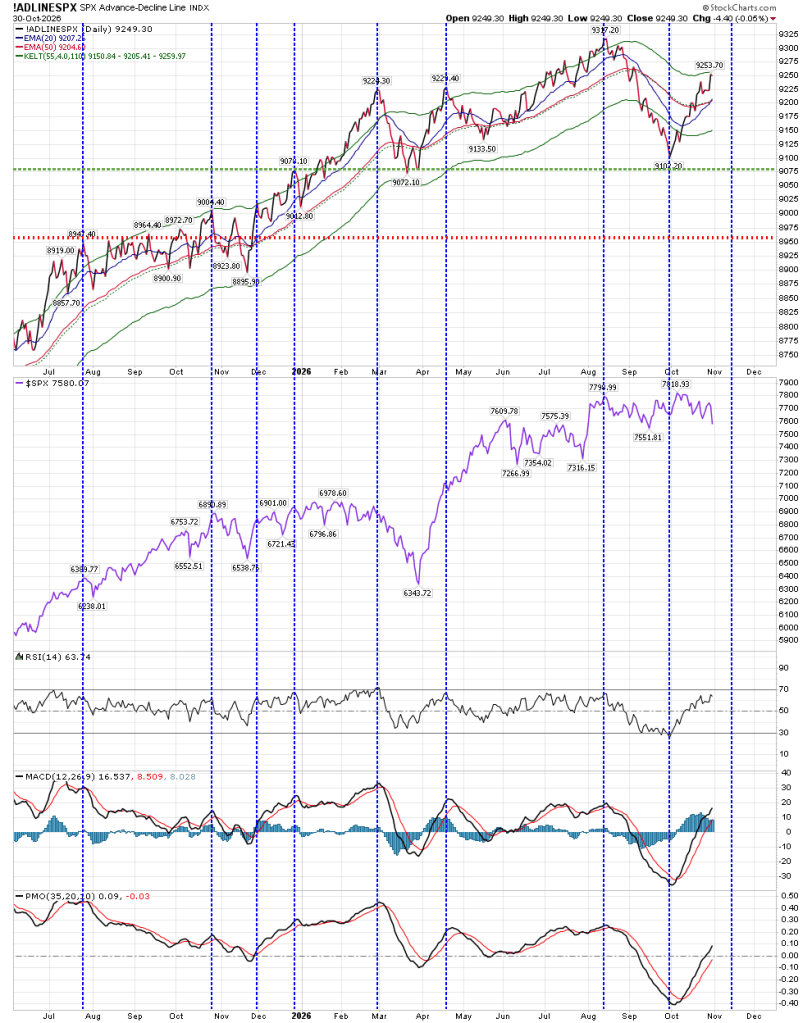
One chart that I haven’t mentioned lately is the Advance/Decline Chart. It too suggests strength until November 13 (although it is reaching the resistance of the upper Keltner band):
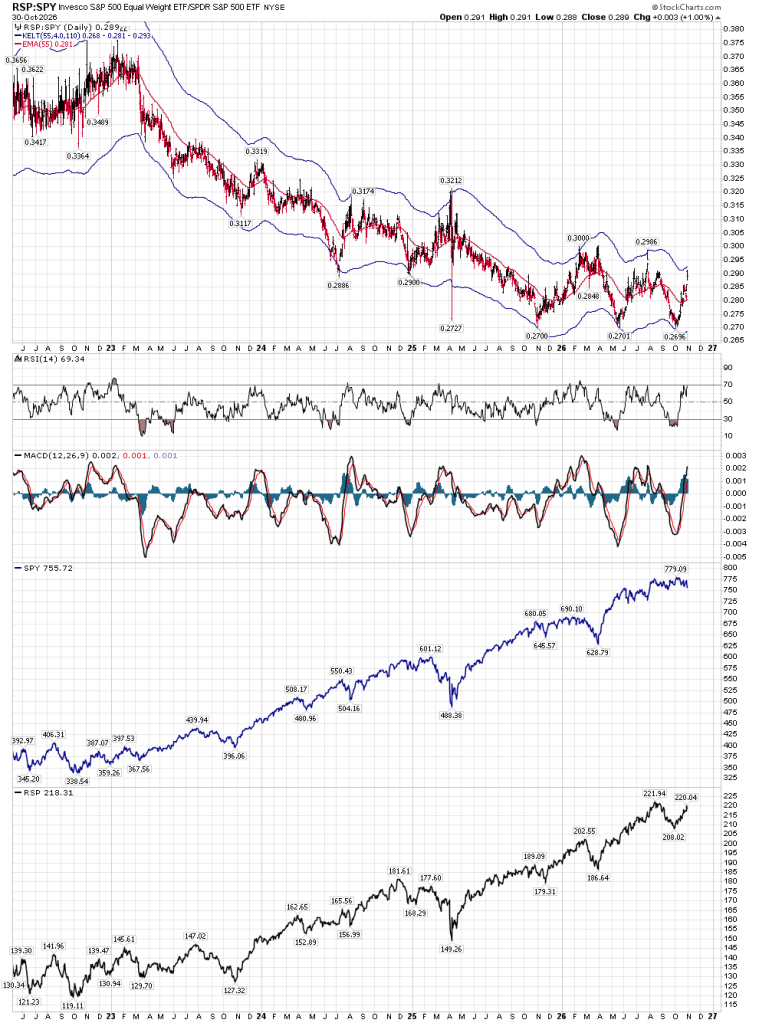
A major question that exists is how far the equal weighted RSP can advance against SPY. Over the long term, the following chart shows us that we may have reached a triple bottom. That will only occur IF we can move above 0.30. Presently, we are very close to the upper Keltner band, which may act as resistance before we get the opportunity to get that breakout.
A few weeks ago, I wrote that Price was the “Great Arbiter”. Let’s hope that we can get through the present turbulence. The support I mentioned last week for RSP was 213. That still stands.
Best to your trading.


When drawing the current T, why did you not start the left side back on the mid April peak?
LikeLike
Because of the lows in May and June. While they weren’t low enough to create a new T, they kept the VO below the zero line.
LikeLike