
I have made clear over my last few posts that while many of the indicators I follow show formations indicative of positive market forces, I am not able to confirm a new T-Theory T based on the refusal of the McOsci and the SPX Volume Oscillator to move above the lows set prior to their moving below the zero line.
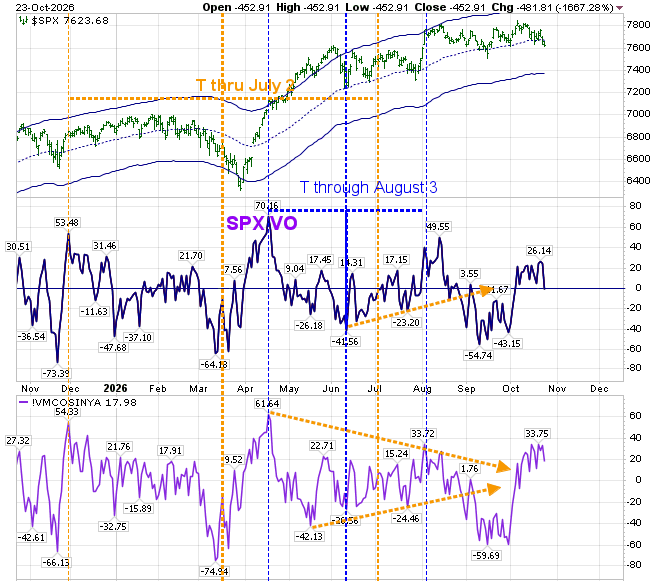
The main T-Theory SPX Companion Chart shows Price staying near the middle of the Keltner Bands.
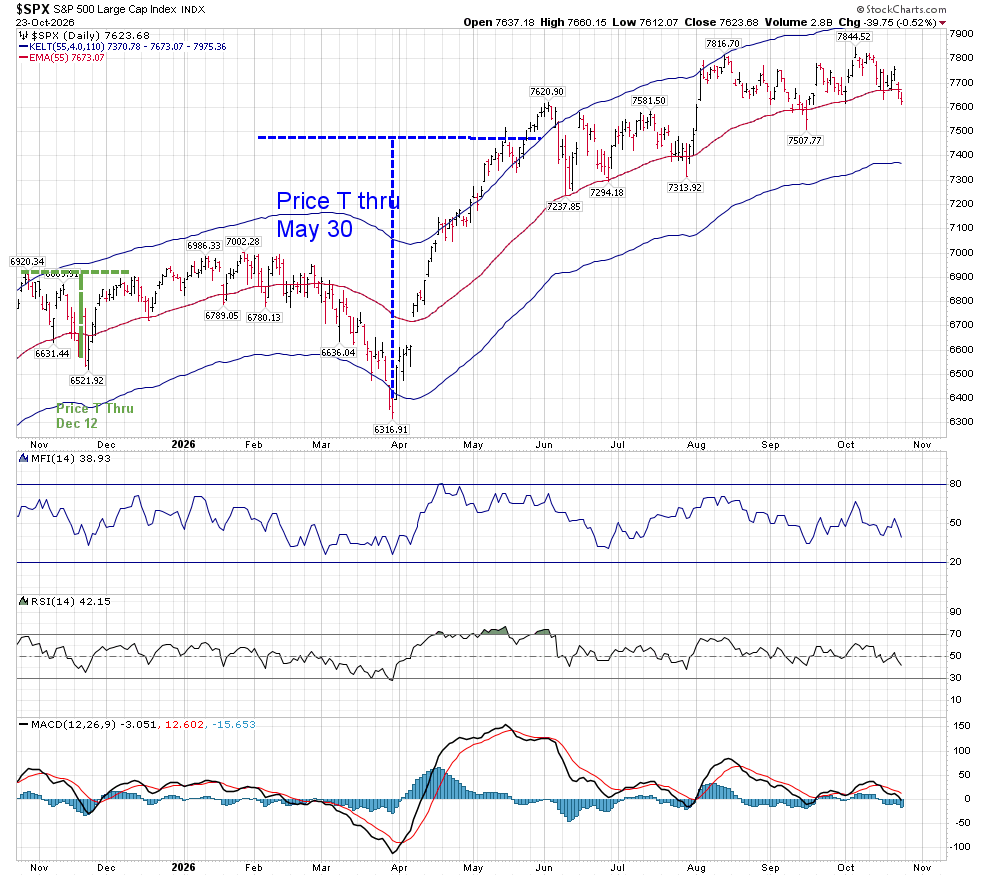
Why am I taking this point of view? If I were to review the SPX using my old methodology of the Volume Oscillator (which used NYSE Up/Down Volume), I would be forced to draw a new T, and it would have occurred precisely where I forecast months ago that it the orange dashed line for the VO hit the zero line on its way back up:
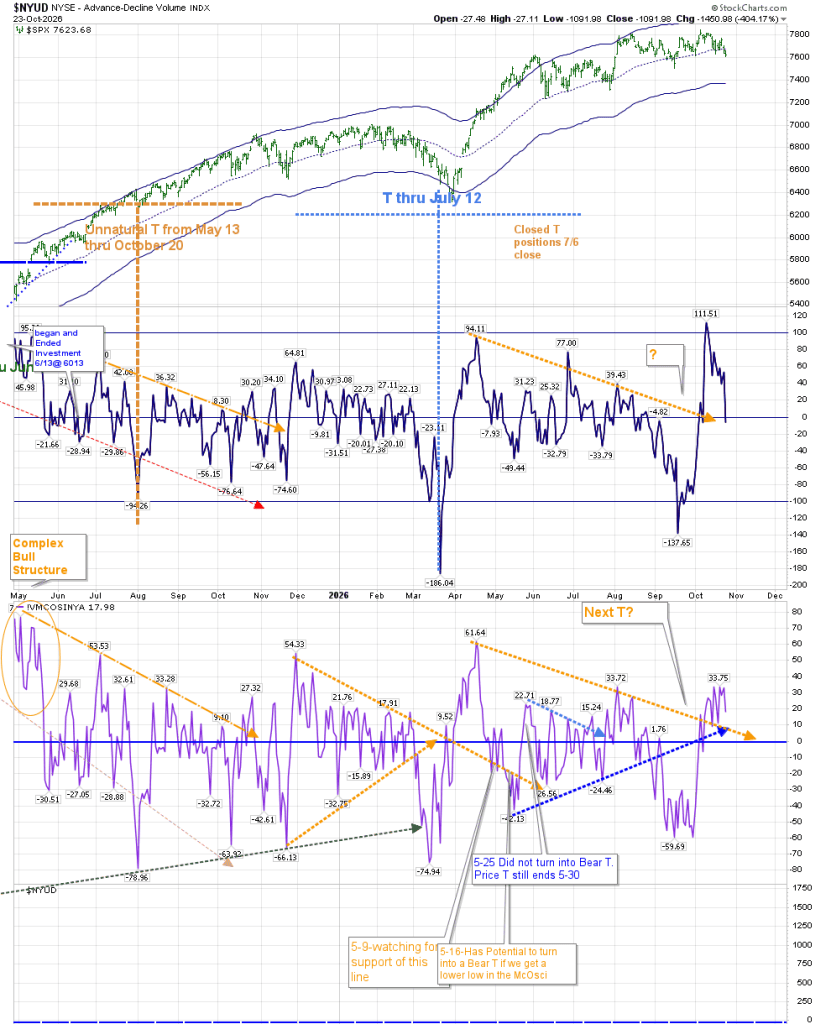
But the market has changed since Terry Laundry developed his T-Theory methodology. Terry used the NYSE as his T indicator. As he wrote:
Super trader Marty Schwartz who used this oscillator for some decades claims that one is better prepared to use the day to day pattern for finding bottoms or tops if you plot the oscillator values by hand on real graph paper. Watching the pattern for tops and bottoms evolve from one day to the next gives one better perspective on how this volume oscillator tends to anticipate changes in price trends. The computer generated chart is helpful, but he claims the day to day plot helps to get the better feel for its leading characteristics.
Each day after the market close you will need to obtain the net on balance volume data for the NY Exchange.
I found it easier to use StockCharts’ version, but there is an inherent defect in the tool that causes it to overstate the most recent reading, which eventually gets “smoothed out.”
I’ve explained before that the NYSE is made up of many closed-end funds. By moving SPX-only indicators, I have tried to make my T-Theory chart more reflective of the SPX’s movements, and its periods of extra strength. And thus, I’ve begun using the SPX Volume Oscillator.
But the market has changed even further over the past 10-15 years. We have the megastocks with similar Tech and AI characteristics that have a weighting of between 30-35% of the SPX Market cap. We’ve had periods in the past with similarities, but not to this extreme. For example, we had the Nifty 50 in the 1960-70 period with about 28% weight, and the Dot Com era in 2000 where Tech and Telecom had a 26% weight. Prior to the SP500’s present structure being initiated in 1957, we had market breadth narrow to an extreme level in 1929. I am not saying the present situation will result in a similar outcome, but it’s something to be aware of.
Which brings me to the indicators I use to confirm my T’s, beyond those created by Terry. These include the BPSPX and the “Simple Chart.”
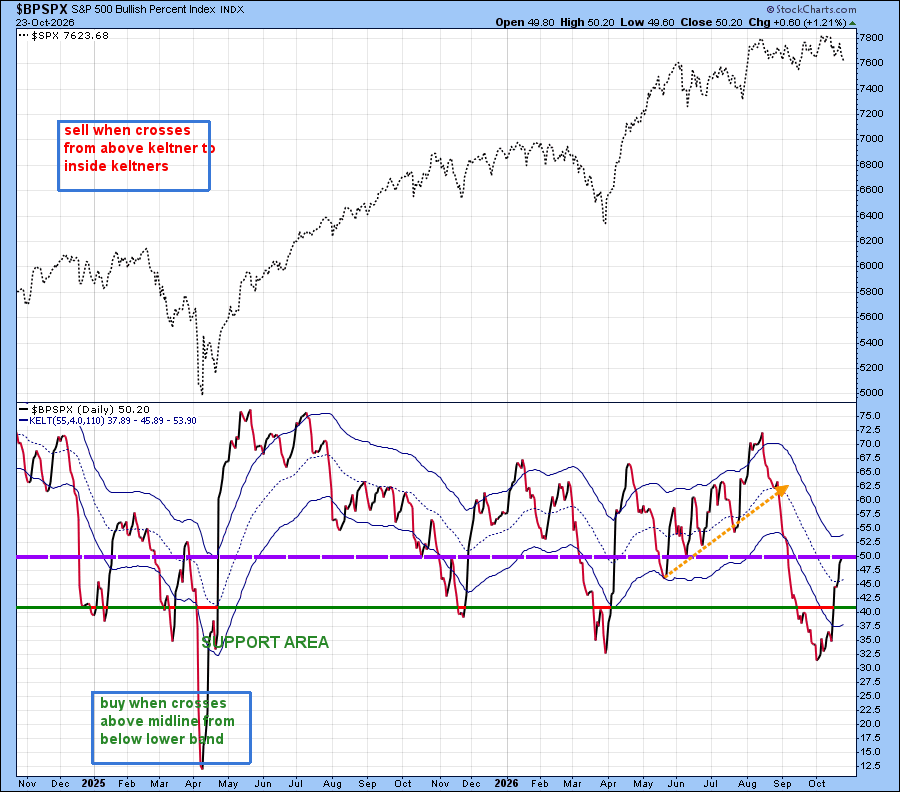
The BPSPX is the bullish percentage of all 500 SPX stocks. When it is above a reading of 50, a traditional reading of this indicator is that there is a bullish slant to the SPX. I have refined it to be aware of the change of direction, and by using the Keltner Bands to surround it, I look at whether the trend change is significant enough to change Market direction. Keltner bands. Keltner bands are based on Average True Ranges, which means above or below helps me forecast direction.
The “Simple Chart”, created by Carl Swenlin of DecisionPoint fame, reviews Breadth and Volume Intermediate Term Oscillators.
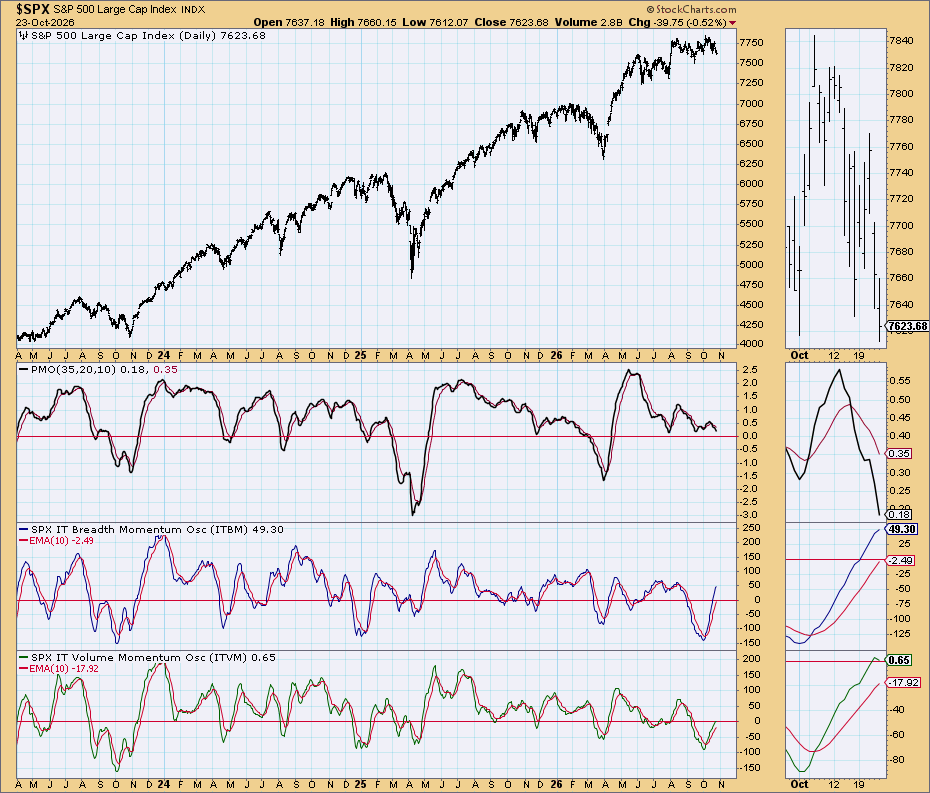
If you’ve been reading this blog for years, you know these charts, and how I include them in my analysis.
So again, why am I fighting considering the present situation to be a Magic T? My reasoning is that Price has not followed through successfully, based on the low readings of all of these indicators prior to reaching their recent lows. The totality of the low reading that existed before mid-September should have caused a massive, sustainable move higher in Price, and it didn’t create one. Now I have to be on watch for a Bear T that will be created if we have lower readings on the McOsci of -60, and readings lower than -55 on the SPX VO.
That being said, the SPX as a whole has been trying to fight off this potential Bear T. A review of RSP shows that on an equal weight basis, individual stocks are fighting to keep momentum at a standstill, if not positive.
A case can be made that we have a Price T in RSP that will last until November 13:
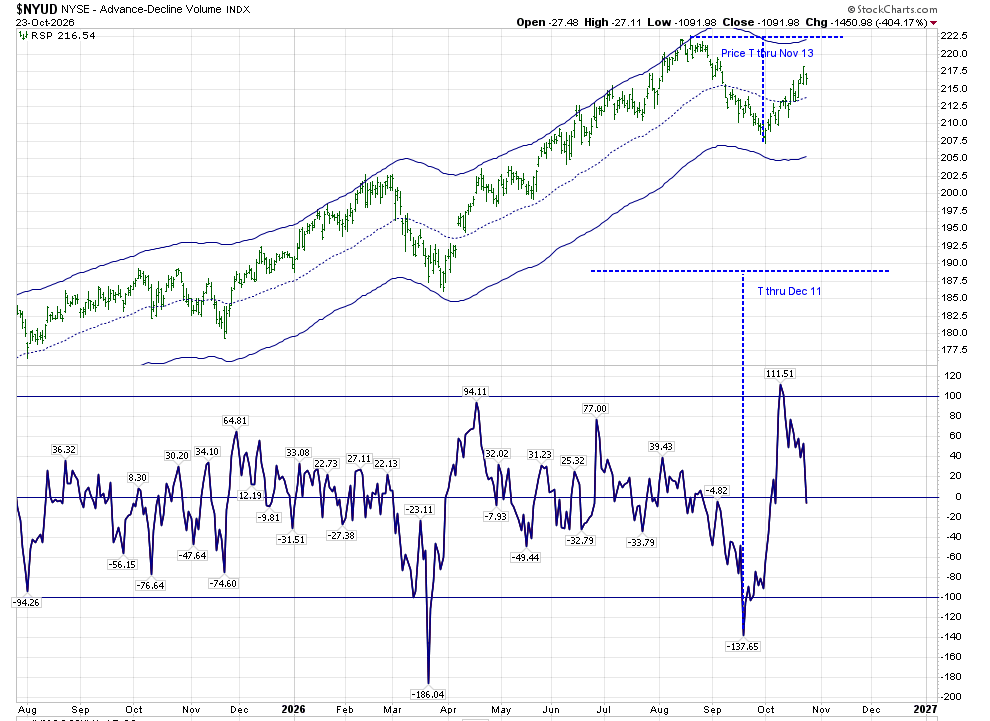
And there is a possible VO T in RSP through December 11.
I’m not sure if this strength will be able to fight the flow out of the megacaps that we’ve been witnessing recently. But it’s certainly on my radar. And it is certainly a safer place to invest at present than SPX.
On a daily basis, right now RSP is close to being overbought, at least temporarily, we may see a pullback here that should hold 213, if the strength is to be continued.
Best to your trading.

