
Readers of my posts on Elliottwavetrader.net may know that I consider RSI, or the Relative Strength Indicator as an extremely important adjunct to T-Theory.
While it is normally measured for the same period (14 periods is the norm), one should keep in mind that using it as a trading tool on its own for individual stocks will give varied results, based on the volatility of the stock you are reviewing. A crypto mining stock will have many more overbought and oversold readings than a utility, for example. It is one of many tools, and those here should use it accordingly. Price, which is the key technical indicator, is more easily quantified by itself, and having Elliott wave fibs gives you not only projections of future price, but also (and for me more importantly) areas of support and resistance.
Many may not look at RSI as a momentum indicator, but merely look at it for overbought and oversold regions. Personally, I have found a way to incorporate RSI for points of recognition of change in that momentum trend. I become vigilant when RSI reaches overbought and oversold readings, but I wait for a cross back to a non-extreme reading to utilize a trade strategy.
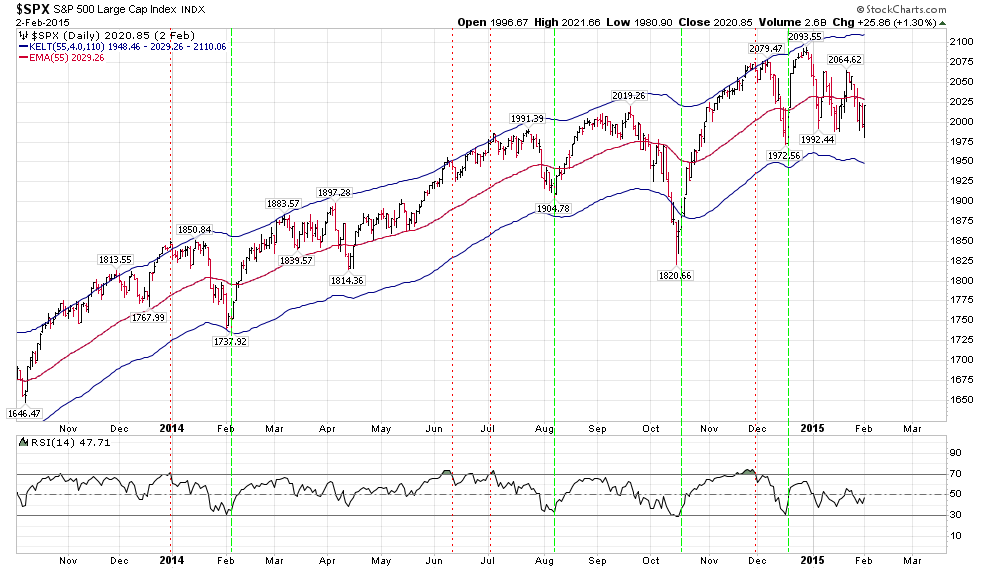
I believe the above chart will show that overbought readings can go on for a while without a considerable move lower, but in a bull market this will be the normal case, as RSI tends to base at 50 rather than 30, and Price tends to remain above the mid-Keltner bands. This bull market/50 RSI basing has been marked on the Companion Chart I post here.
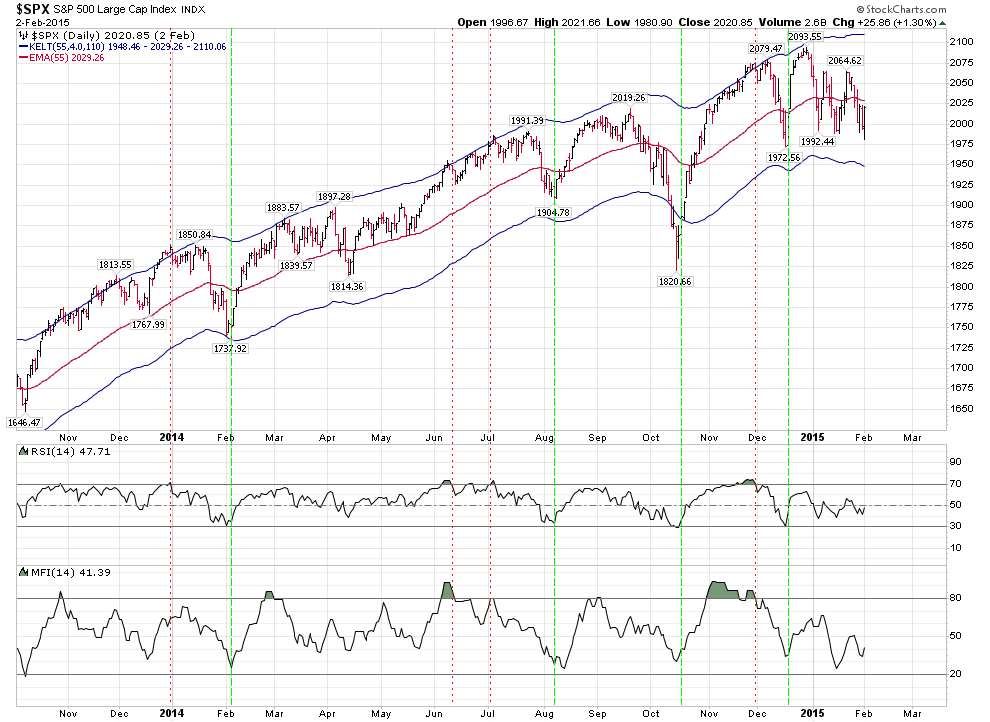
Adding MFI to this chart adds an extra dimension of information. When RSI and MFI agree on an oversold or overbought situation by showing shaded areas above or below these extremes, I wait for them to reverse into their normal ranges from these extremes as confirmation of a change in trend. (Of course, this is done in conjunction with my T-Theory main chart, and watching the support and resistance posts of our analysts.) The chart below has the same vertical strength/weakness lines as the one posted above.
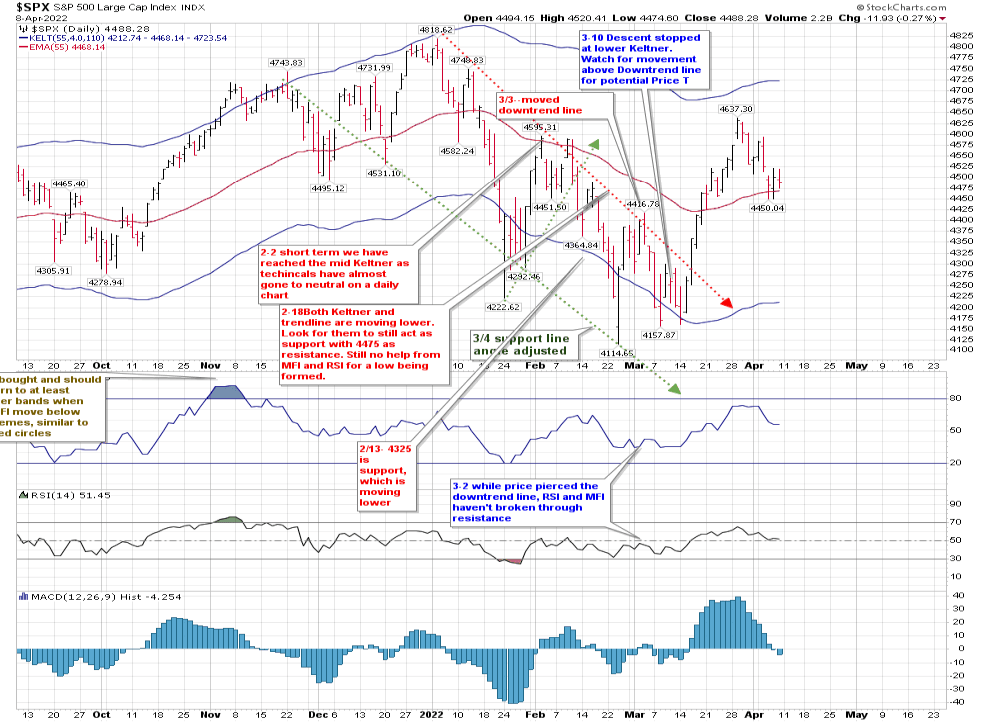
Looking at where we are now, Price is hovering at the mid-Keltner, while RSI is at 51 and MFI is also near its 50 mark. Price is stabilizing at that mid-Keltner, but it needs to pass that down trending line of lower highs while RSI and MFI are fighting to stay above 50.
Last night I posted the hourly chart, which is showing more weakness than the daily.
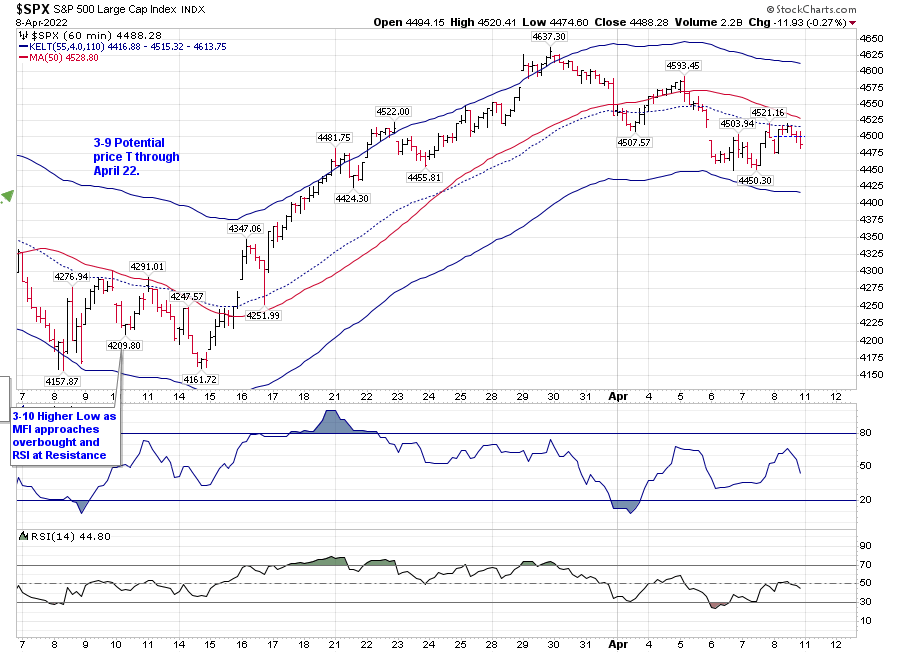
As I noted, waiting for a break above Avi’s yellow 2 is a wise path right now, in my opinion.
But that’s not what this post is about. It’s a discussion of Relative Strength. I’ve seen lots of posts, and made them myself, showing ratios between two stocks or asset classes. Terry Laundry had a Confidence Index which I post that asserts the ratio of price on a Corporate Bonds ETF to a Treasury Bond ETF shows you the confidence inherent in the market place. It is currently at an extreme.
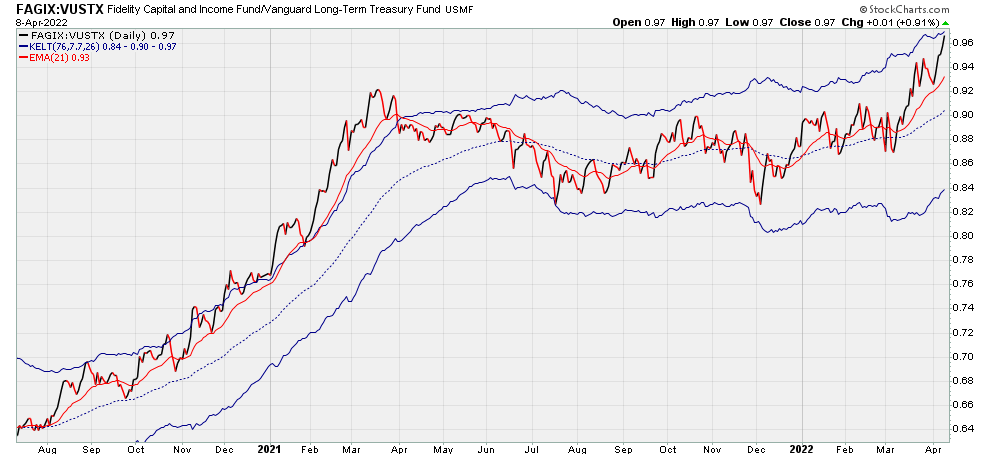
Another way of reviewing this would be showing how the spread between Corporate rates and Treasuries has narrowed. It is at 1.78. Something has to give. By about 80 basis points in my opinion. Which of course, doesn’t mean it has to happen. But it should.
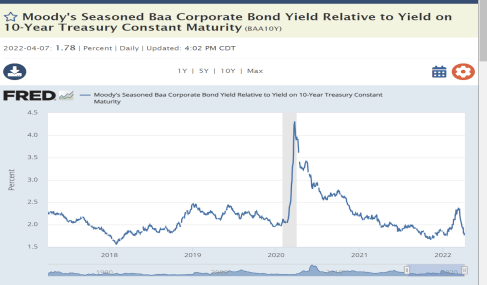
And yet, that is not what this post is about.
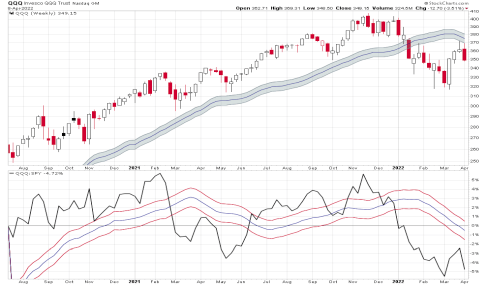
It’s about a tool created by Parker Binion,who used to write over at the T-Theory web site with Terry to review Relative Strength in a meaningful way.
Using Parker’s parameters, the following chart represents the relative strength between QQQ and SPY:
And here is IWM vs SPY:
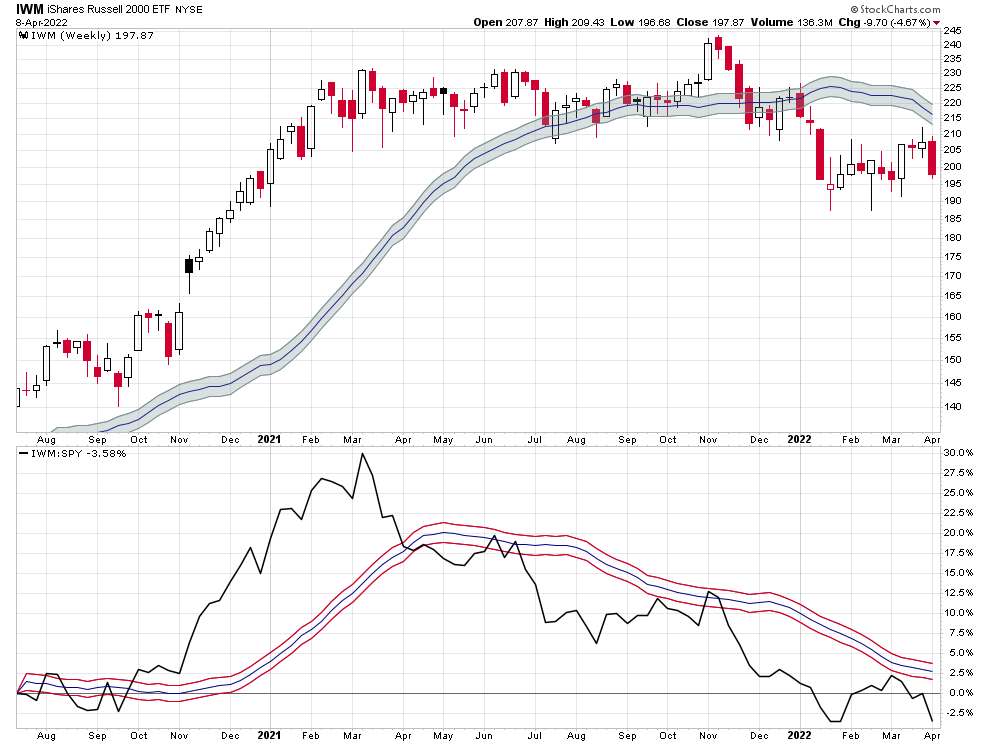
The link for this chart will allow you to put any asset in place of IWM or QQQ, and show you its relative strength over time to SPY.
And if you’re interested, you can use the Gold miners version of the chart. Just replace NEM with any miner to see its relative strength against GDX.
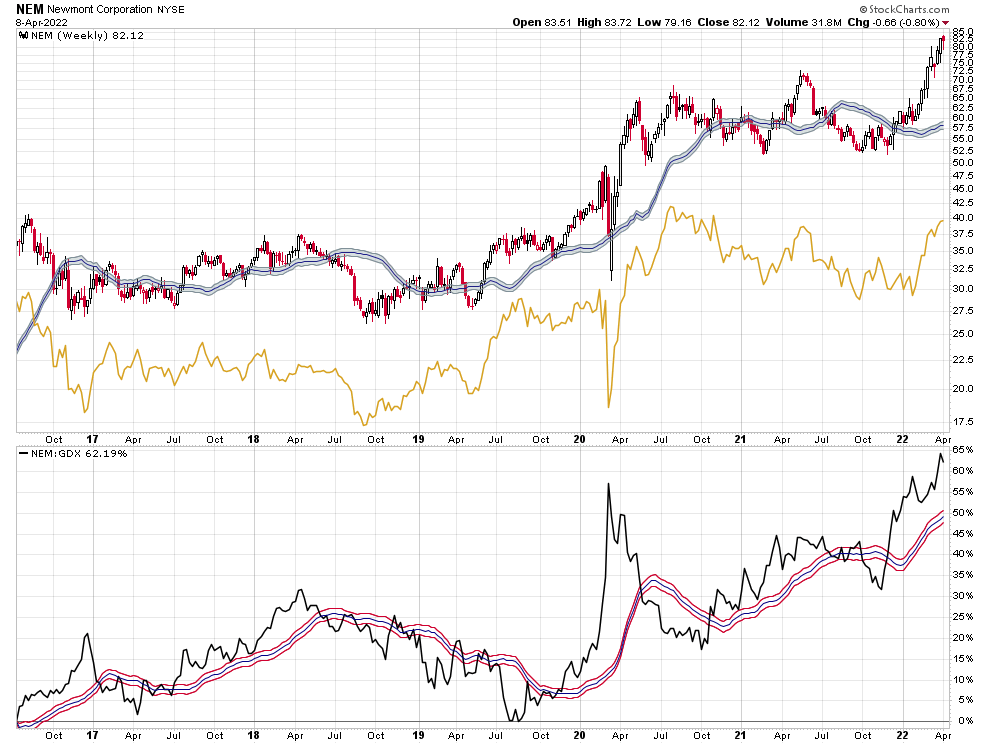
Here is the link:
I’m sorry if I’ve gone off on a few tangents, but age will do that to you. I’ll be out on the lake Monday. I hope you have fun too.

