While the Volume Oscillator T will continue through June 24, I advised those who are members of ellottwavetrader.net that I was closing my position when the market rebounded Friday to 6013, before it collapsed into the close.
As I pointed out last week, my personal indicators suggested that there was a possibility that the T could end June 17. Since I’ve captured most of the advance since April 8, this wasn’t a difficult decision. I’m traveling right now and not able to create a full post.
Doom sells papers. But sometimes things are just what they appear to be. In the present case, we are just on a roll that will eventually end, but using the existing rules of T-Theory as I understand them, we are in a bullish Volume Oscillator (VO) T that will last until June 24.
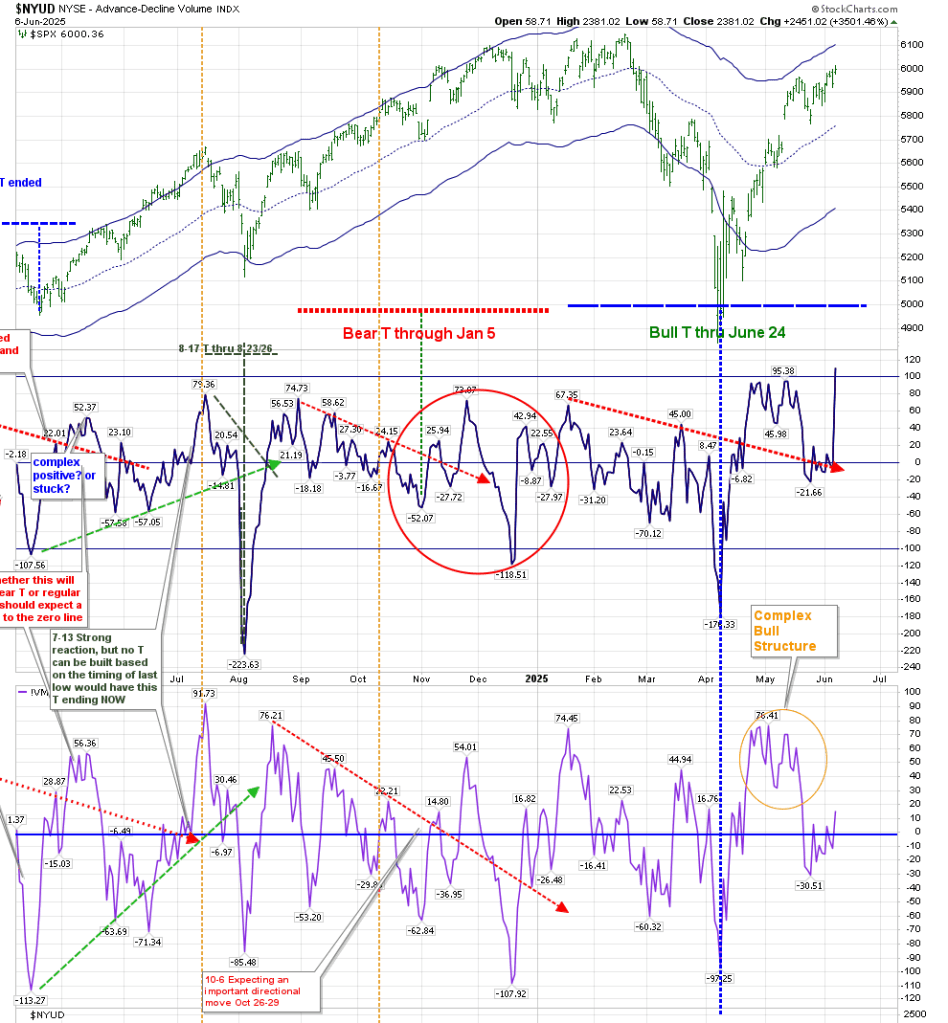
Our T’s this year have been very clear on direction. A Bear T ends with a rally at its end, followed by a collapse. That is what occurred , and it was then followed by the present Bull T which doesn’t need to collapse at its end–it merely ends the defined period of “extra” strength, after which we would expect equities to produce a return not above that of the ten year Treasury.**
The VO and McOsci have recaptured positive territory after making their expected returns to the zero line. Following the trading signals I’ve mentioned since on April 8 on elliottwavetrader.net, we’re up about 1000 points. The April 17 post (after a move off the lows of about 300 points) suggested an end to the rally. That was wrong. After missing the next 250 points, I confirmed the new T (on April 27) which we are following now. We had a Price T (in May) that I suggested would end around May 16, allowing us to capture some of that missed advance, as the market dropped 200 points. This offered a re-entry, or at least a hedging of positions.
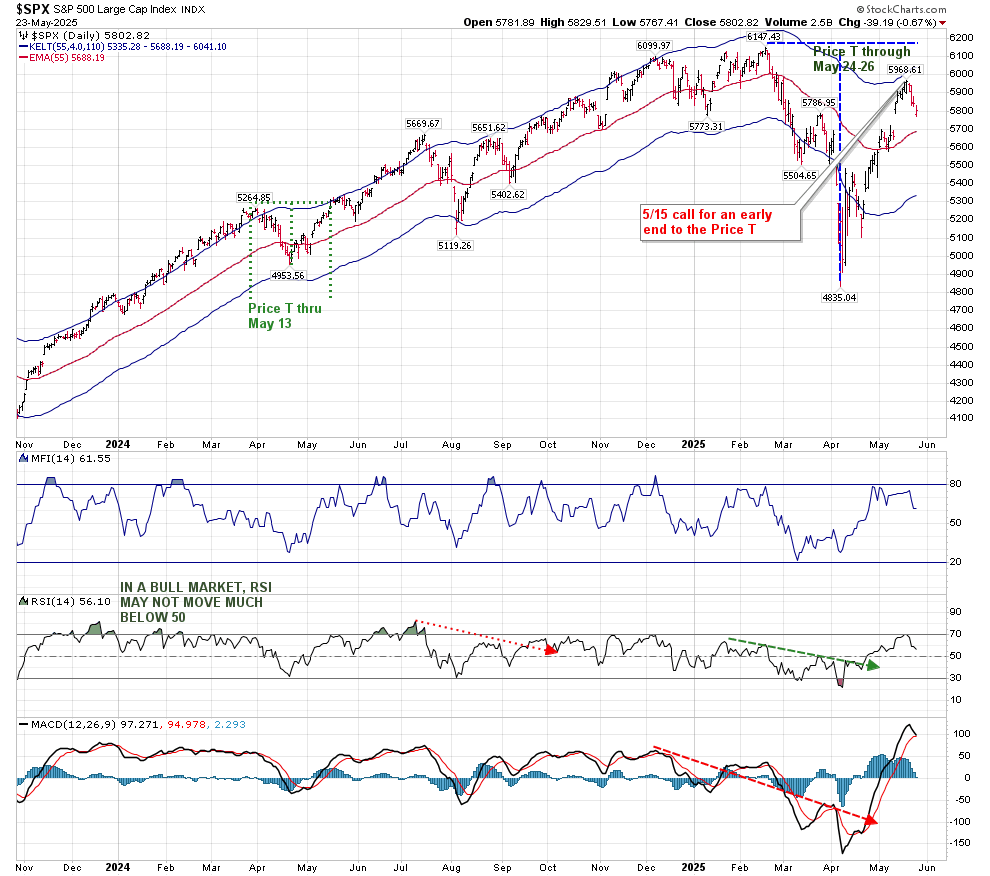
While I still expect Price to climb through June 24, the bulk of this move is hitting what I consider a strong range of Price resistance. Friday’s high was just a point or two away from the lower part of a resistance zone I’ve been suggesting since January:
But while I’m on alert for a pullback, there’s very little technical confirmation of a change of direction at this time. BPSPX and the “Simple Chart” that I have used for years are not changing direction. Sometimes things are just what they appear.
There is a chance that June 17 can evolve into an early ending of strength, but it hasn’t developed into a reliable date at this time.
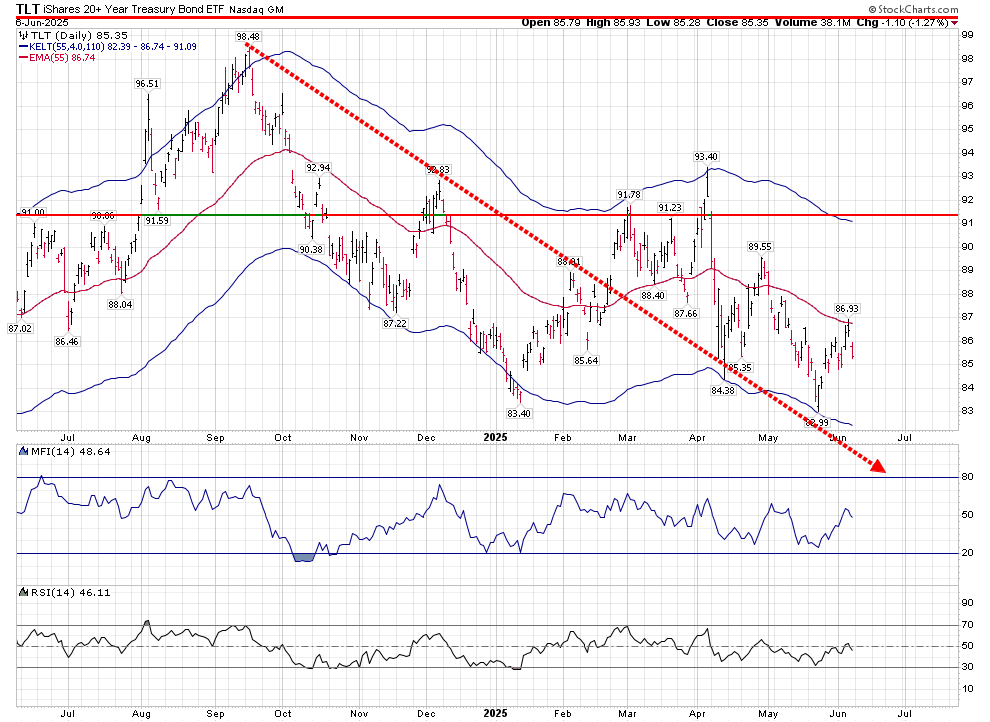
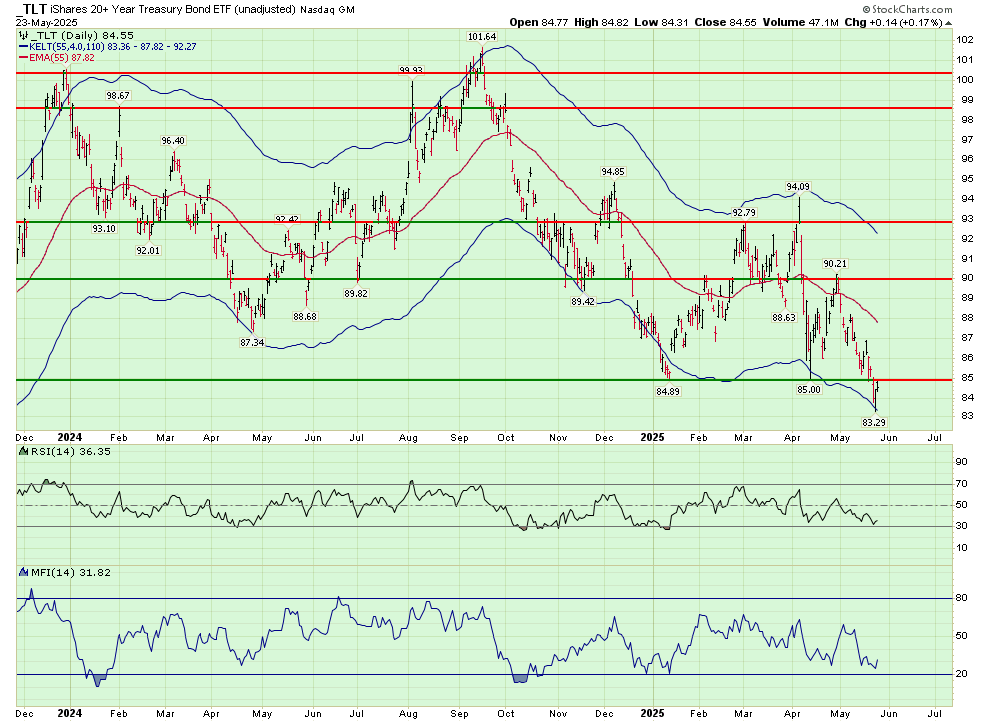
Counter to my thoughts on long term rates, TLT has advanced lately, but was stopped at the middle daily Keltner band:
It needs to break above 87 to create traction.
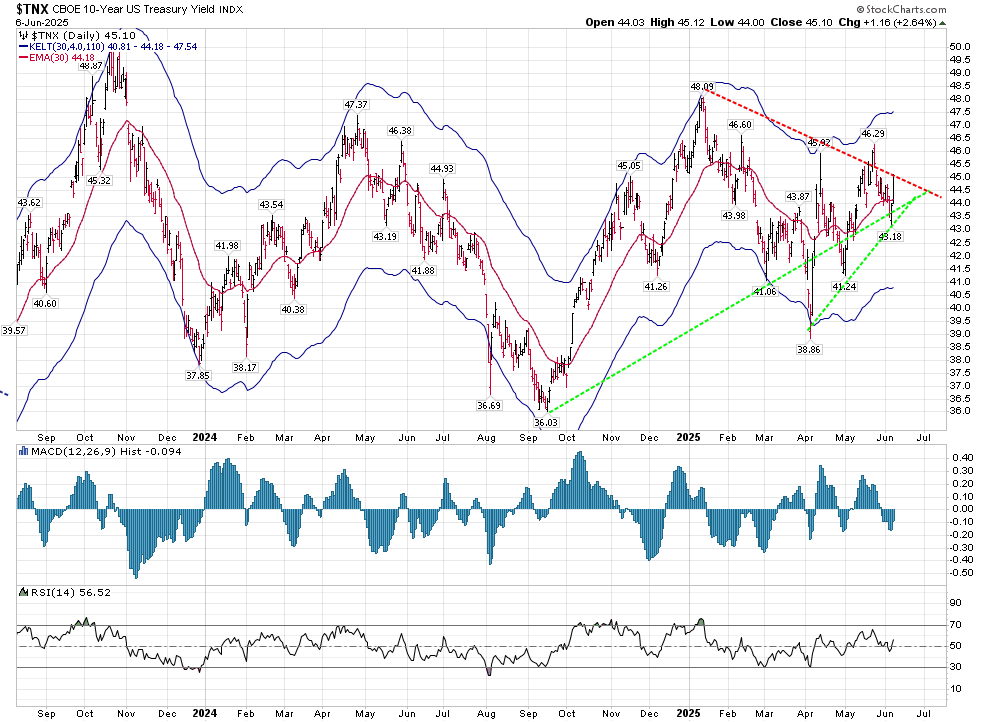
**Coincidentally, I am seeing a critical event developing in the Ten Year Treasury rates just around the time the Equity T is scheduled to end:
In last weekend’s update, I reviewed an early end to the Price T (which was due to end May 23) within the context of the larger Bullish Volume Oscillator T (that exists until June 24). I discussed my expectation for that early end to the Price T, based on technicals.
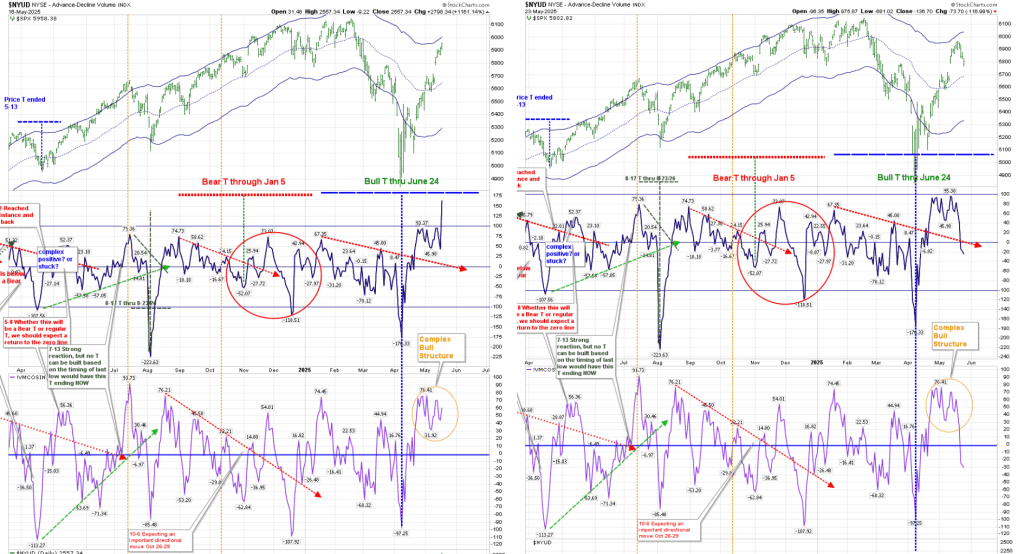
We normally expect a return to the Volume Oscillator zero line on the right hand side of the T to occur much earlier than occurred in this instance. I believe that the Complex Bull Structure (shown with an orange circle) delayed that return to zero, but it has finally taken place.
Interesting on its own is the fact that this return to the zero line happened when the red line denoting the lower peaks in the VO crossed the zero line. (That is normally a point at which I expect the formation of a new T.) Those who have been following my posts here (April 18) and on elliottwavetrader.net may remember that my initial thought was that I expected weakness to last until now–the middle of May. That was based on where this red line was due to cross the zero line. While that premise was incorrect based on how the VO T developed, the Price T did end (for all practical purposes) at that Time.
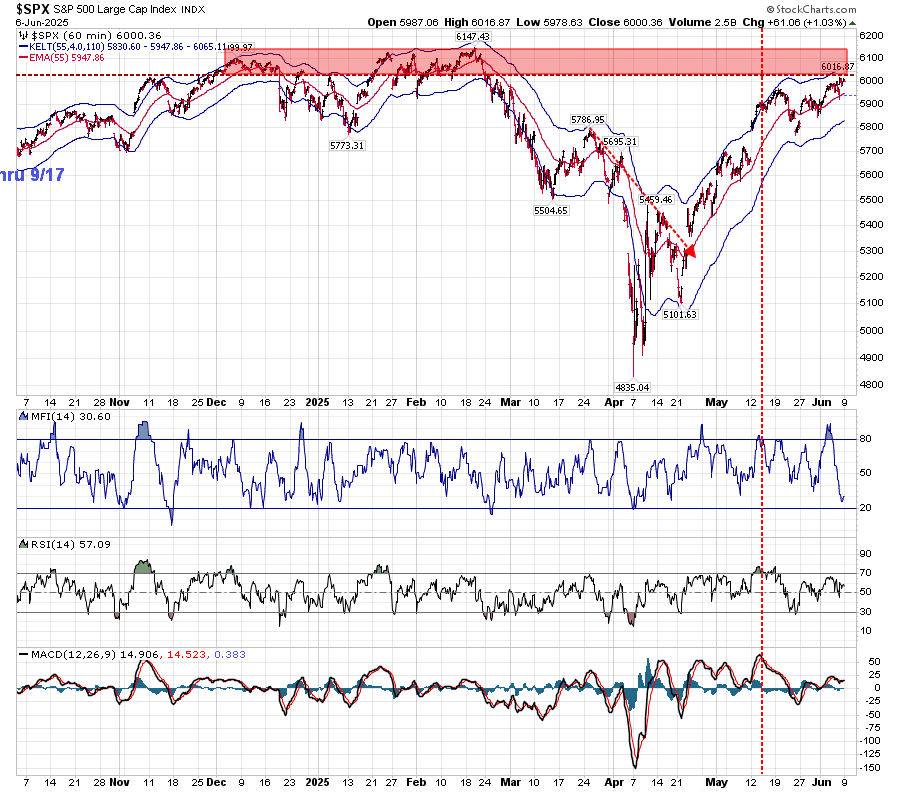
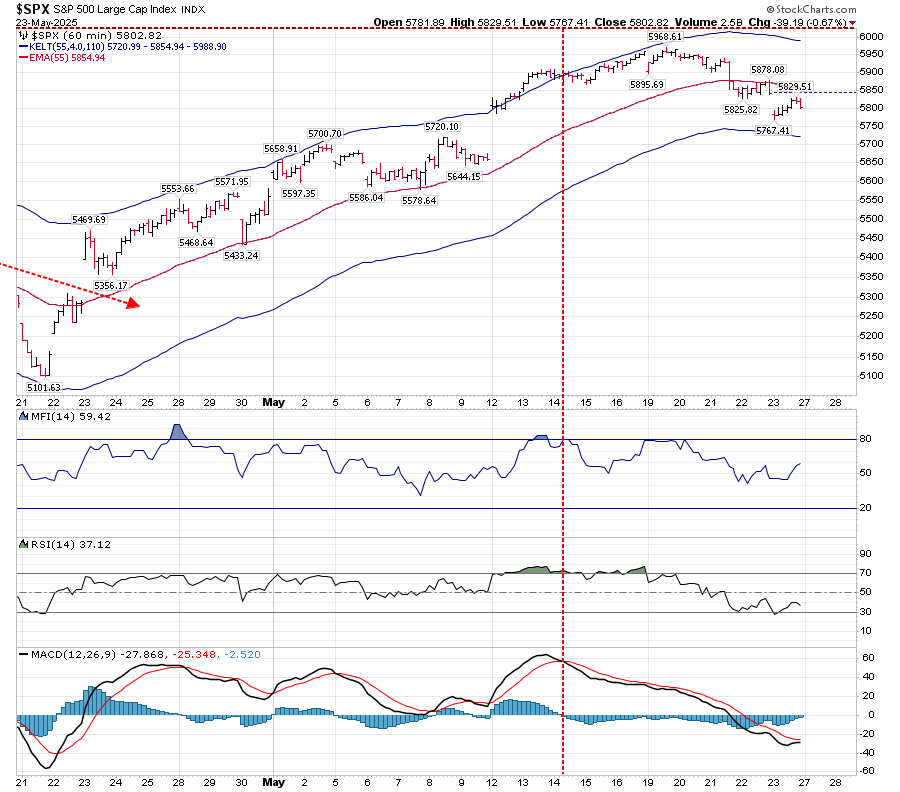
It would be extremely difficult for this VO T to become a Bear T. To do that, the VO would have to break down below -176, and the McOsci would have to move below -98. This is not my base case. We are traveling within the lower half of the hourly Keltner Bands:
This may be considered as a resting period from the sharp move up in April, as we are nearing support in RSI. MACD appears to be ready to either cross positively, or just kiss, and continue to move down.
On the other hand, the Daily T Companion chart shown above shows MACD approaching a critical crossover or kissing point. As I mentioned in a post on elliottwavetrader.net, the relative height of the MACD is immaterial. MACD is a momentum indicator, and until the fast line crosses the slower red line, MACD is showing a positive trend. I also pointed out that because of its incredibly quick ascent, it wouldn’t take much to create a negative MACD–it’s like a roller coaster at its peak. Support here is 5688, as shown by the middle line inside the Keltner bands. Price needs to continue to close above this line to support the VO T.
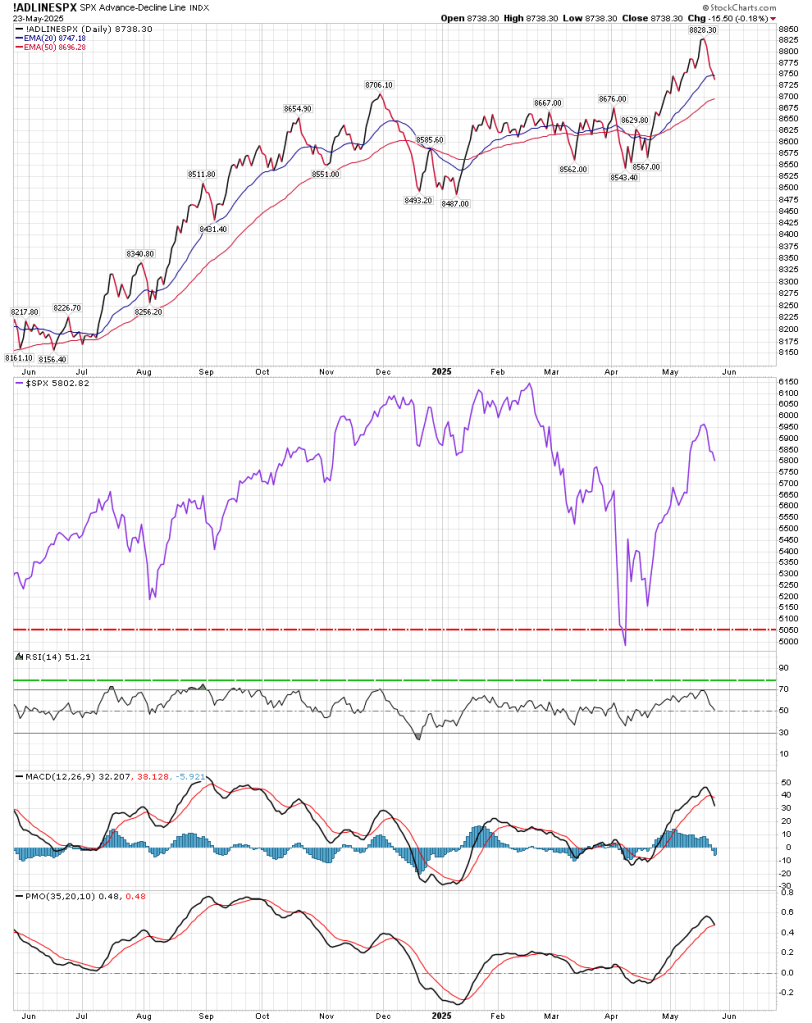
Outside of the standard T-Theory view, the “Simple” chart has turned negative in the intermediate term on both Breadth and Volume. That is concerning. The BPSPX (Bullish Percentage SPX) chart has turned down, but it is still above the upper Keltner Band. Until it crosses below from above that upper band, it is a positive. It is also reading 69%, and any reading above 50 represents a positive outlook. I will also point out that the A/D line has passed below the 20 EMA, and needs to hold the 50 EMA:
TLT moved down about 2% this week. While it did bounce off the lower Keltner band (now at 83.36), I’m not looking for a sharp reversal at this time (I use the green background to denote this chart doesn’t include dividends):
The high on $TYX this week was 5.113%, but it closed at 5.031%–up from last week’s 4.899%. We have an administration whose answer to Moody’s downgrade of US Treasury Bonds was “Who Cares?” Evidently the bond market did care.
I would like to apologize for a typo in last week’s report. It should have read as follows:
At this point (versus 2011), long term rates as visualized with TLT have not been “static”. They are pointing HIGHER.
(Please note this was corrected online from lower—5/19).
I’m not planning weekly posts, but might do so if conditions warrant.
I’m back from my travels. One of the highlights of my trip included a visit to El Escorial, near Madrid, where I encountered the mural shown above in the Library. The door on the left is marked Falsitas, while the door on the right is marked Veritas. Which one will Zeno’s students walk through?
The main reason for this site is to offer continued review and guidance based on the concepts created by Terry Laundry. To that end, let’s review the present state of the market through the prism of T-Theory.
Without question, the present formation represents a bullish T, with an ending date of June 24.
What makes this such a strong bullish move is the formation of a Complex Bullish Structure (marked in orange), where the VO and McOsci have refused to offer even an expected return to the zero line after creating this T.
My personal view (offered here April 18) was that we still had a 2-4 week wait for a new T to form, and I felt that the rally I suggested in my April 8 note on EWT (elliottwavetrader.net) was complete. However, on April 27 I confirmed the new T while traveling, with SPX closing at 5525 on Friday April 25, missing 240 points of this rally since April 8. This Thursday evening, I suggested in a post that one should look for a pullback to begin shortly within this larger T.
Why did I suggest a pullback was near at hand? In the formative days of Terry Laundry’s T-Theory, trader Marty Schwartz “borrowed” Terry to create Price T’s. We have one ending next week:
Some of my personal indicators had started to turn down from extreme regions. but I’m going to forego sharing them at this time.
On a shorter term basis, here is the hourly chart:
The above chart shows that we haven’t had a negative MACD since April 24. RSI since then has held support at 50, and in fact spent all of last week in overbought territory. These are bullish indicators. Additionally, since April 24 Price has stayed above the middle Keltner line. That is present support at 5822. On a daily basis, support is 5650. Both of these supports offer a continuation of the bullish T.
Bonds are where the bulk of my investment funds lie, and therefore they are my main focus. In my last report, I discussed where I think long term rates have to “live”. The 30 year rates on April 17 were at 4.809%, today they are at 4.899%. My range for this continues to be 4.53-5.36%.
The bond market will have to face “news” that Moody’s lowered the credit rating of our Treasury Bonds. This shouldn’t be news to anyone. We’ve built an unsustainable system.
The last time we had a change in rating was on August 5, 2011–here is how markets reacted:
The status of equities and the long bond was much different before that last announcement than it is today. Stocks were moving lower and created a short term bottom with that news, while long term rates were static but moved lower (TLT higher) after that Standard and Poor’s decision.
I would not read the same results into today’s market. While history does repeat itself, it does so when multiple factors align–we have a Wednesday every week, but we don’t eat the same meal every Wednesday–unless we are visiting the same restaurant, we don’t even have the choice to eat that same meal. Do not let your biases decide what has to happen with this news. At the present, bonds are no longer supported by QE, and Operation Twist was put into place in September of 2011. If you’re going to use historical inference as to what to expect the bond market to do based on “the last time”, then you need to incorporate a full repertoire of information.
At this point (versus 2011), long term rates as visualized with TLT have not been “static”. They are pointing HIGHER (please note correction from lower—5/19). Price is under both the 50 and 100 weekly EMA. The 100 EMA is what Terry Laundry used for the weekly Optimum Moving Average of VUSTX, which was the fund he utilized for bond trades.
My portfolio of bonds hasn’t changed since my last report–nothing with longer maturity than 3 years.
I want to double back to my opening remark regarding Zeno’s offering doorways to Truth and Falsehood.
We’re living in an age where Truths and Falsehoods abound with no shades of gray. However, there are many doors marked True and False that are neither. And there are doorways created to make us think we’ve arrived at the entrance to what is True and what is False that offer neither. We construct our own ideas of Right and Wrong based on heredity and environment, but we are all capable of that “Eureka” moment when clarity is revealed beyond the markings offered to us by others. To do so, we must try to put our biases behind us.
It’s been about 5 months since I posted, and this long weekend gives me a chance to review where we are. It’s been quite a journey since the beginning of the year. On January 5, I posted (linked for those with an account at EWT) on elliottwavetrader.net a post called “Perspective is Everything”. In that post I discussed “Outlier Years”. We had just completed 2 strong years of a bull market with no end in sight based on the percentage increase for both 2023 and 2024. But just as I had spent most of 2024 asking how much would equities have to lose in order to get people to sell, my cautionary note ended with:
One of my themes last year dealt with percentages. Where would the average investor become concerned, and based on the percentage returns last year, [that number] would require quite a drop? But the mind resets in January for no logical reason.
We have definitely had that reset in thinking. As I posted in EWT on March 28, I am looking for weakness in equities to last at least 2-4 weeks longer. At that time, hopefully a T can be created.
Price has been unable to meaningfully pass above the lower Keltner band. Thursday was a much stronger day in the McOsci and the VO than is reflected in the closing price. Bullish Percentage on SPX has passed above the lower Keltner, but is still below the midline. By traditional standards it would need to move up above 50 from its present reading of 38 to show strength in the indicator. But that is the top of our upper Keltner band, which makes it a much less expected outcome. The Simple Chart is still showing negative breadth and volume. I’m not including those charts in this post as there are many more to follow in this report, as I move on to a more worrisome situation, which has major ramifications for US equities.
Continuing on to bonds, on February 20 (linked for those with an account at EWT) I posted on elliottwavetrader.net the price range in which I expected bonds to “live”. It was based on where bonds “lived” for most of the time between 1998 and 2011–even after the period of the Great Recession in 2008. “Living” in an area means that you are reasonably priced–in asset classes, that is knowing what the Optimum Moving Average is, and watching for movements above and below that number. But before we get into that, let’s look at an Andrews Pitchfork of TYX (30 Year Bond), showing TYX’s movements within the pitchfork from 2008-2022. In my opinion, this is the period during which TYX lived outside its normal “living” area. My thoughts are based not only on the chart, but in conjunction to the inflation information during that period. (EWT members will be able to refer to that information in the linked post.) This Pitchfork was built using a starting point at the peak interest rate of 2000, with the fork’s tines built from the bottom of rates in 2008, to the top of 2011.(I’ve been posting this chart on EWT since 2015.)
Going back to the premise of the Optimum Moving Average, while Terry Laundry felt that 100 weeks was the correct OMA for the long bond, he and I discussed my interpretation suggesting a 50 week OMA. The OMA should get the most hits on a chart, either as support or resistance. In my opinion, this is hitting support at 4.534%, with the top of the range at 5.36. That is the area where I expect TYX to remain for the foreseeable future. Right now, the weekly MACD is curling higher, forecasting higher rates.
A different graphic version of this chart follows. (Please use the scale on the left side of the chart to review the rate.) We are “living” in that area between 4.3 and 5.9%, as denoted by the brown horizontal lines.
While a green MACD crossover usually means it’s time to buy long term bonds, as my EWT post of February 20 suggested:
Plotting the future course of rates is similar to charting anything else. Right now, I hope no one is investing in long term rates for the long term, because the situation is extremely sensitive in my opinion, to intense volatility.
Outside of my technical considerations, there are issues that bonds are facing that are unprecedented. Some of these were discussed today in an Op-Ed published in the Wall Street Journal entitled “An even Dumber Idea Than Tariffs”. We’ve already heard of the Mar-a-Lago Accord, where the administration is considering forcing foreign nations holding our bonds to exchange them for a longer maturity–100 years. In itself, that is a devaluation of the dollar, and would also cause a re-pricing (lower) on our long term bond market.
A second idea “floating around” deals with the US potentially accumulating its own foreign exchange reserve to manage the dollar exchange rate.
But the latest idea “floating around” is installing a tax on foreign holdings of Treasury securities. I can’t see that ending well.
Ideas from this administration are usually “floated” before they are enacted–be it at rallies, press releases or leaks. At some point, many of these floated ideas find their way into reality.
Whether we look at interest rates from a technical or fundamental perspective, the waters are very stormy. Personally, I own treasury bills and notes that mature in less than 3 years, and most of them mature less than 6 months from now. I’m rolling them over as they mature. I’ve been short junk bonds since mid-November, but I lowered my exposure to them recently. Those who are members of EWT know that on April 8 I posted that I was looking for an equity rally to begin shortly, based on how low the Volume Oscillator and McOsci had moved. The move to lessen my junk position was a preparation for that rally, among other moves I made. This rally is not the start of a new equity bull market in my opinion, and has probably run its course.
I’m not sure how often I’ll be posting, as I will be traveling for a while. But it’s time to go back to a closing phrase I’ve used in the past–