It’s been a while since I’ve written a full post, and I know some who read these posts want the main question answered near the top of a post, rather than being forced to read this in its entirety. With that in mind, let me say perhaps expecting the worst is not the best course. Presently, most of the indicators I watch (that are not T-Theory related) are giving off neutral readings.
For those who have access to my elliottwavetheory.net posts, my posts regarding support were on June 10 (regarding the daily SPX), August 17 (regarding TLT), and August 21 (regarding the Nasdaq Composite). Those daily supports have all held, or been breached very slightly for a day or so. In T-Theory terms, one should not expect equities to perform better than the 10 Year Treasury when there is not a T, but in this instance equities have decidedly done better.
There’s an old adage–“when you worry in advance, you worry twice”. There are times when it’s important to worry, but those should be visible within the framework of the technical indicators one follows. Right now, the Richter scale is beginning to show initial signs of a changing market, but nothing has broken. That remains true until at least the earliest levels of support are breached. While you should have a plan based on the possibility of that happening, I don’t believe we are at that point yet.
For those without access to those elliottwavetrader.net posts, I suggested last month that I expected to see a T develop in September. That has now changed.
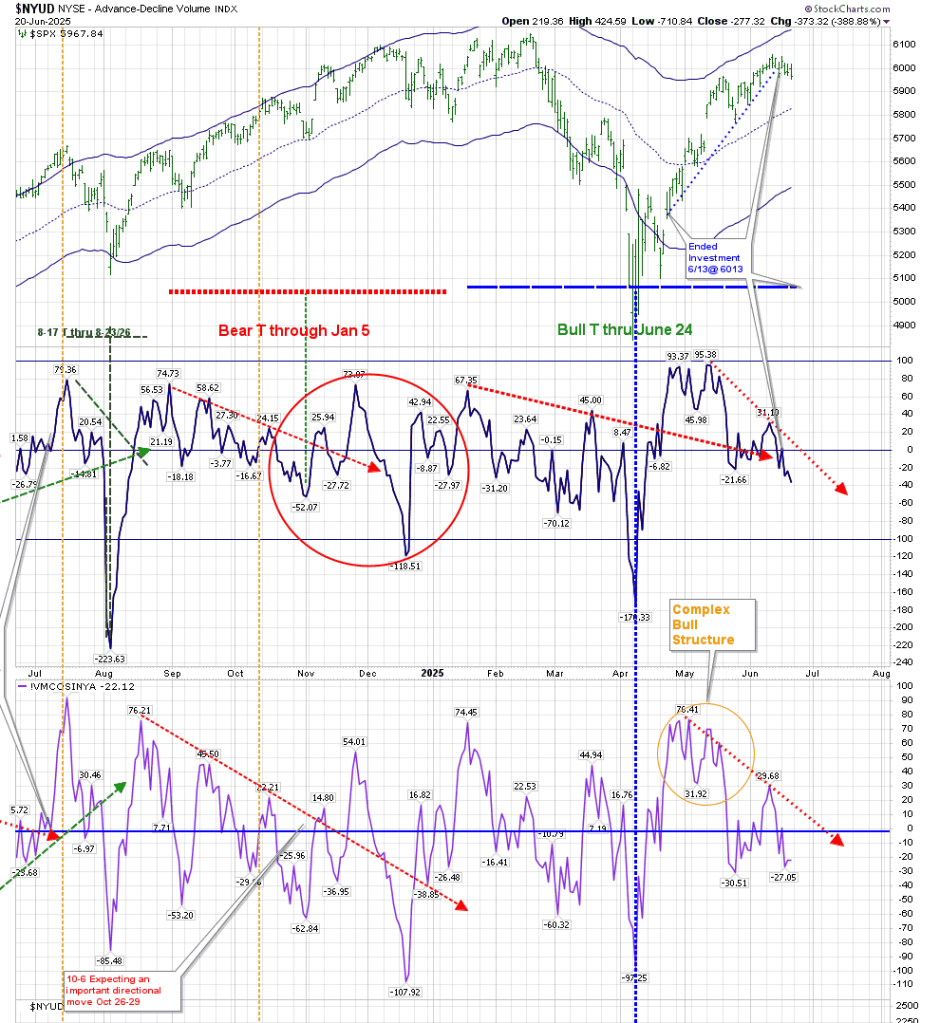
The following chart is the main T-Theory chart. The most recent dashed red line on the Volume Oscillator and McOsci shows where I had initially thought we would get an important low, marking the beginning of a new T. It has been superseded by the orange dashed lines, which now expect that low to occur in October. These descending trendlines–both red and orange–represent Cash being removed from the asset. These funds that are being removed will re-enter the asset in the next period of strength. To arrive at a safe entry point, we would require this line to decline to a deep low similar to the April low. (For those unfamiliar with T-Theory, the August low had the potential to form a daily T, but it has failed to move above the low that preceded its movement below the zero line. This would have been 42 on the VO and 33 on the McOsci.)

On August 25, I posted that there was still no new daily T, and that we may have increased the time until we get a new equity T.
One interesting point to mention is that even though Price moved down yesterday, both the VO and McOsci moved higher. Due to the fact that they are ranging near the zero line, they are not forming a complex positive or negative structure.
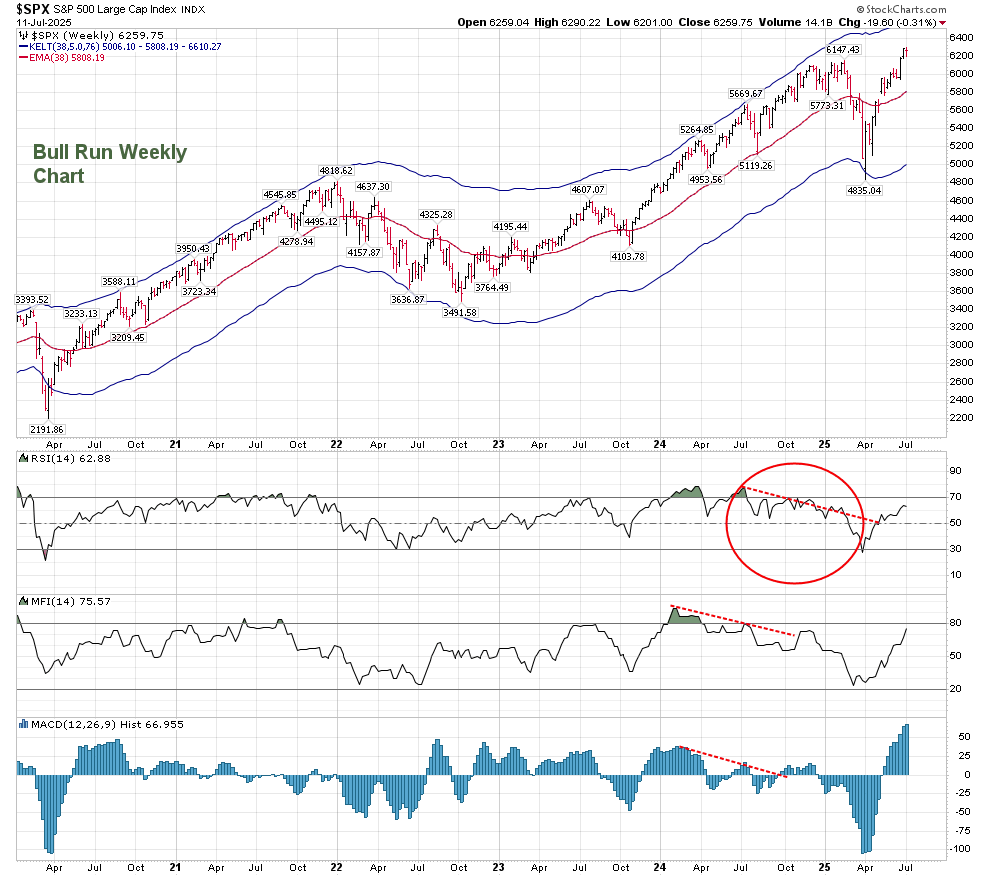
Additionally, even though there is no Daily T, I’ve hesitated to expect a major correction, as I mentioned in last month’s post (and in June on elliottwavetrader.net) there is the possibility of the creation of a Weekly RSI T. This is something Terry Laundry investigated at the end of his career, and I am still hesitant in following it without a Daily T. That being said, it is progressing. The weekly RSI T I posted formed its left side in July 2024, and ends at the end of December. It now looks like this:

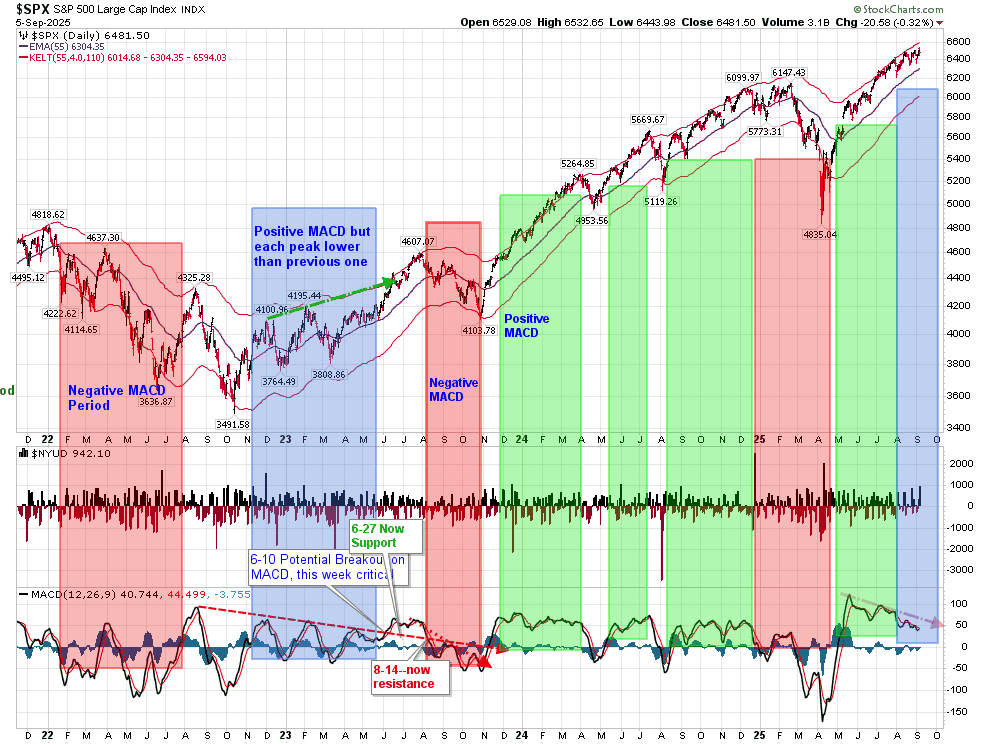
The Daily Companion chart confirms that so far we have been in a Bull phase. The chart does not use the Keltner Bands used by Terry Laundry, but ones that represent the present Optimum Moving Average (OMA) of 35 rather than 55. This shows that support has consistently held even when we corrected since the April lows, just as resistance held until those April lows.

Technical readings on the above chart show an indecisive MACD, which has been receding from its May high. MACD becomes clear when the fast line moves through the slow line. The MACD histogram is maintaining a neutral stance near the zero line. RSI has bounced from an overbought position to the neutral area support, as has MFI.
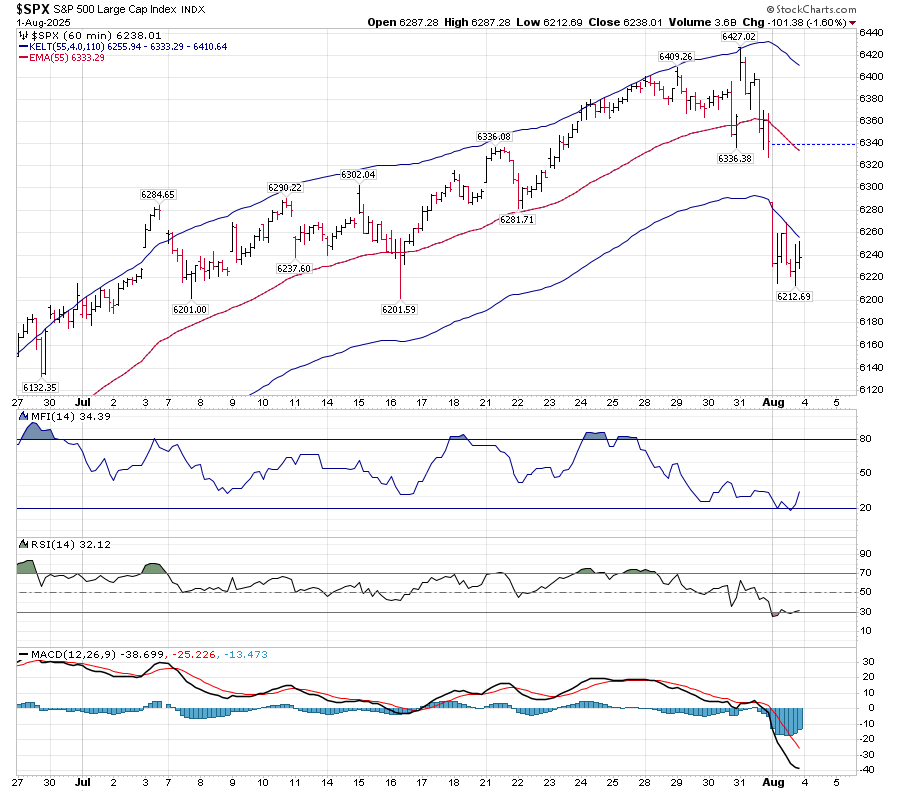
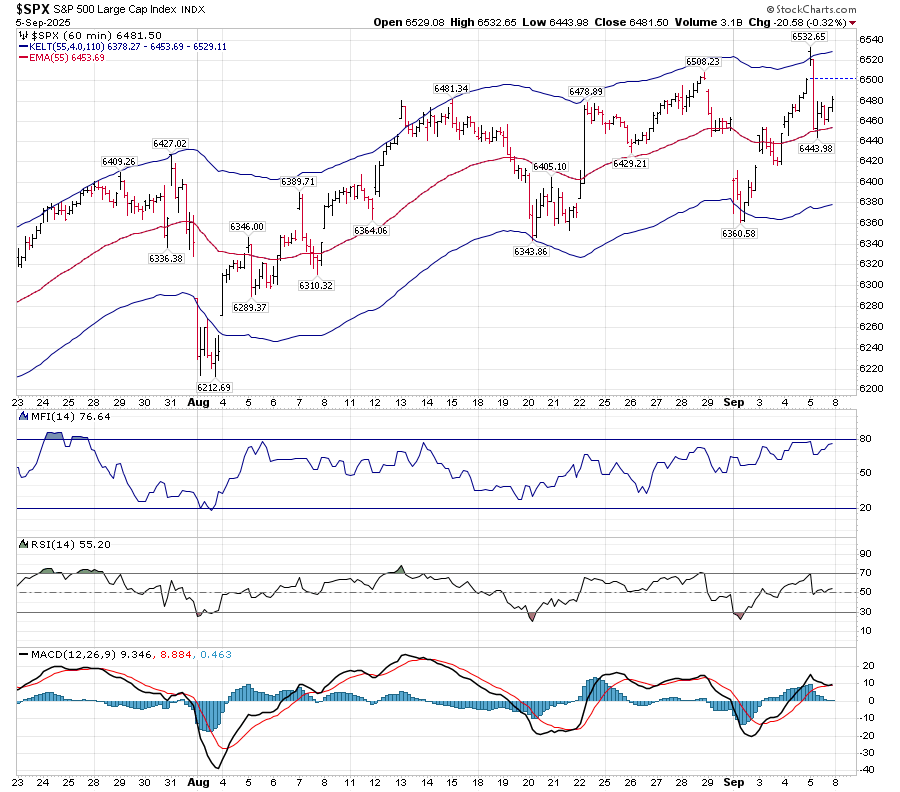
On an hourly basis, Price has shown more volatility, but the Keltner bands show a gently upward trending slope. This upward-sloping movement is a positive in a neutral market. RSI shows that there have been periods where it has been oversold as well as overbought, both causing reversals to the mean. MACD is kissing, and has not crossed up or down.
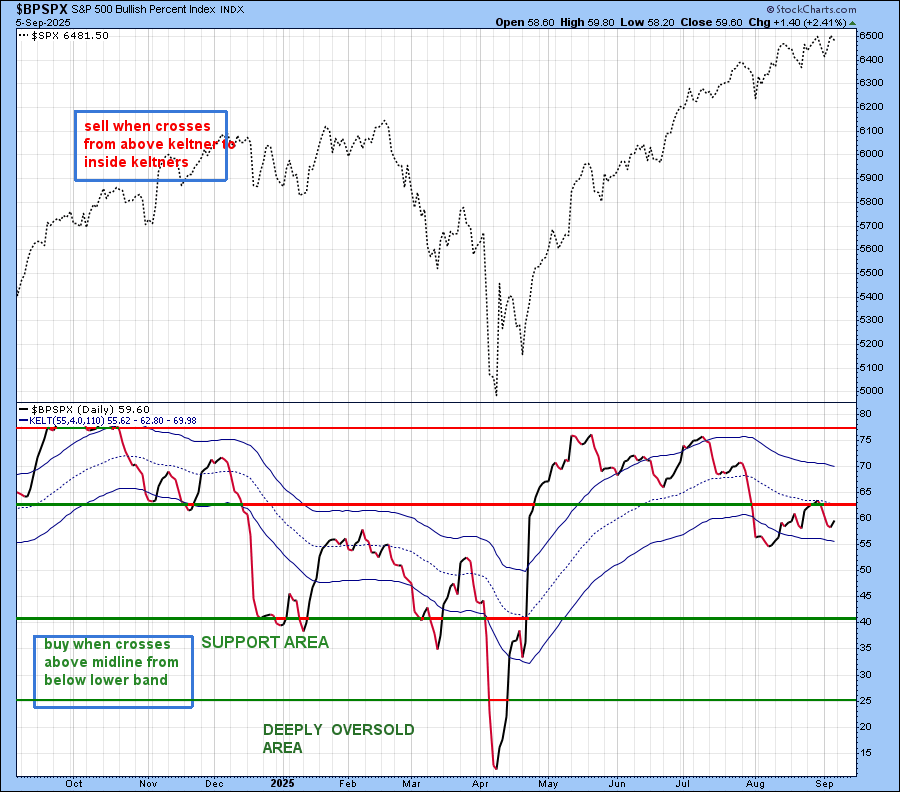
My personal indicators are showing a lack of enthusiasm for this recent move higher. The BPSPX has failed to cross back above the middle of the Keltner Bands. While this is an indication of the weakness of the present trend, the fact that it is still above 50 signals a bullish environment.
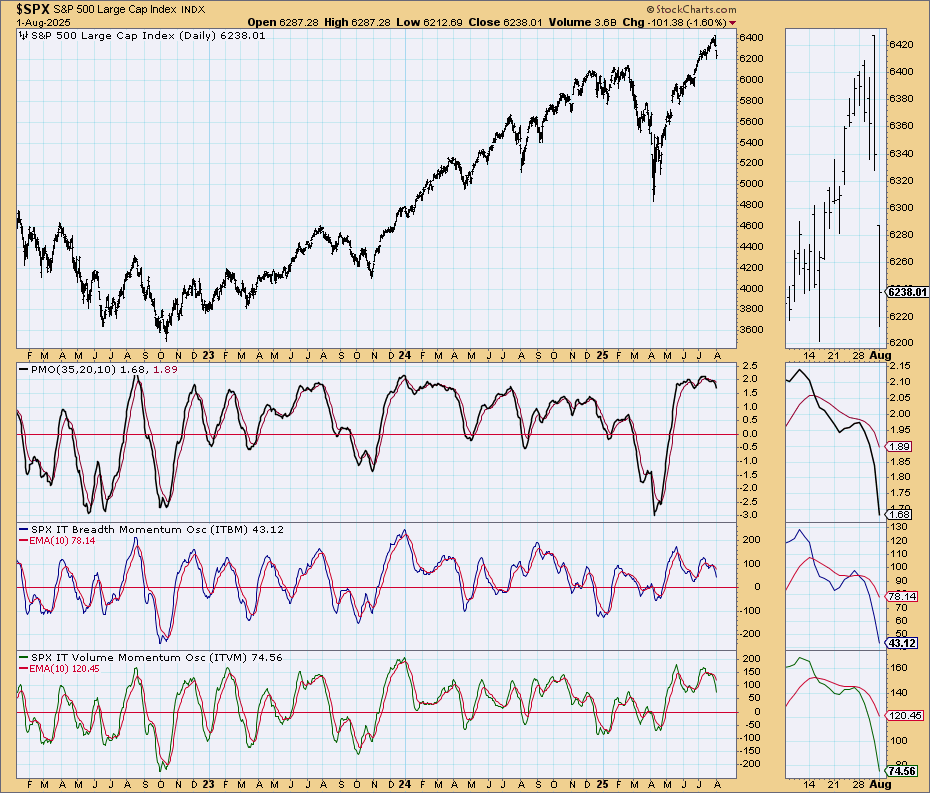
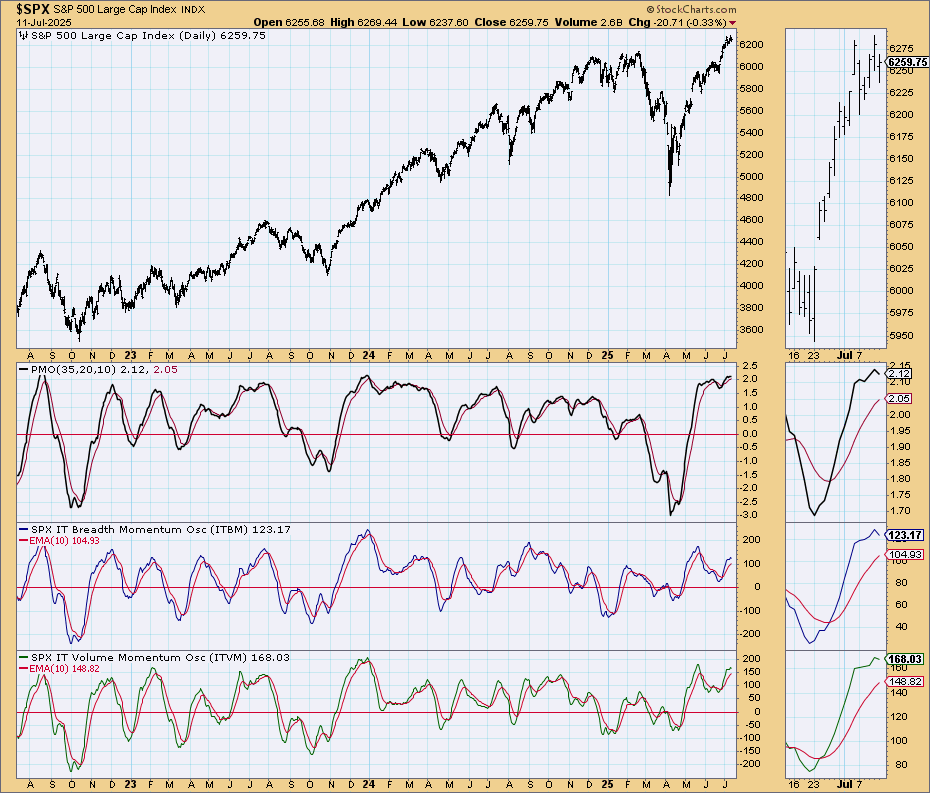
The Simple Chart (from Carl Swenlin) shows no momentum in Breadth or Volume. (But we know the Volume aspect from the Volume Oscillator.)

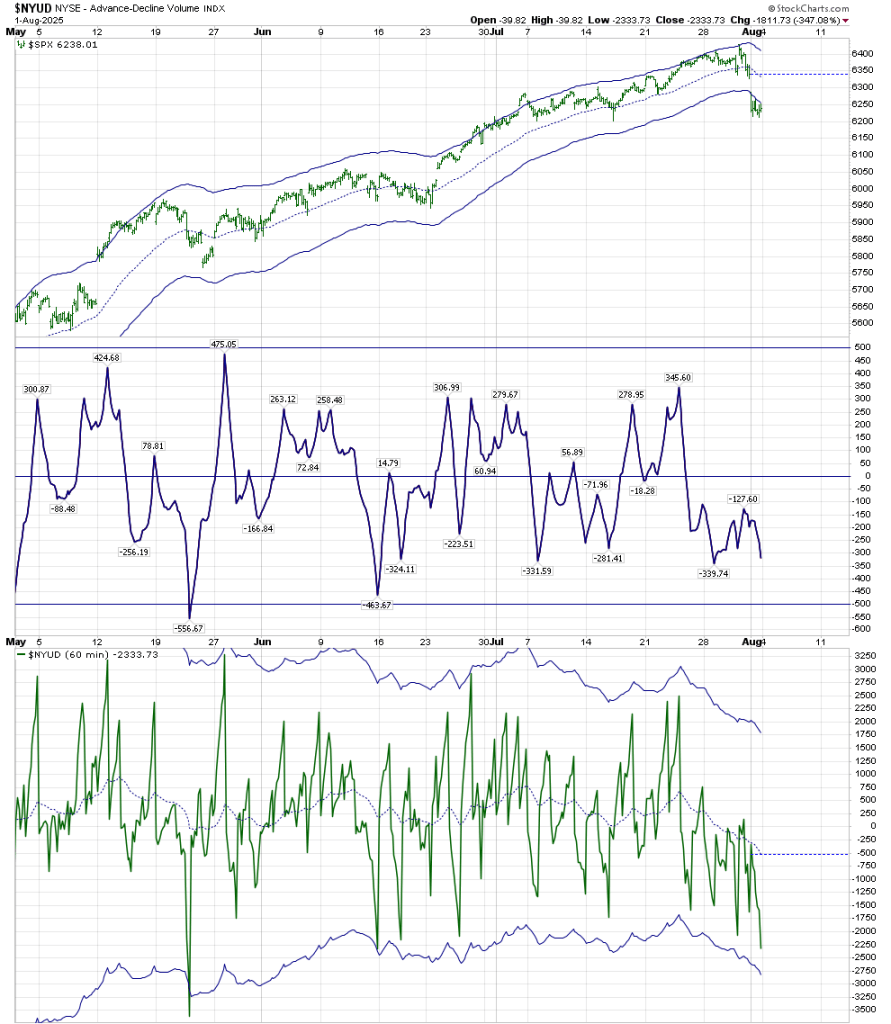
The Advance/Decline line has been bounding off high level support, and its RSI has held the 50 neutral area:

MACD, is giving us a neutral reading at the moment as well. It’s similar to the period of early 2023, where it was positive, but each peak was lower than its prior peak.
This neutral yet positive structure can also be seen in the following chart also developed by Carl Swenlin.

Low risk entry points appear when the Common Stock Only Volume Momentum Oscillator has a critical low below 100, as shown on the following chart:
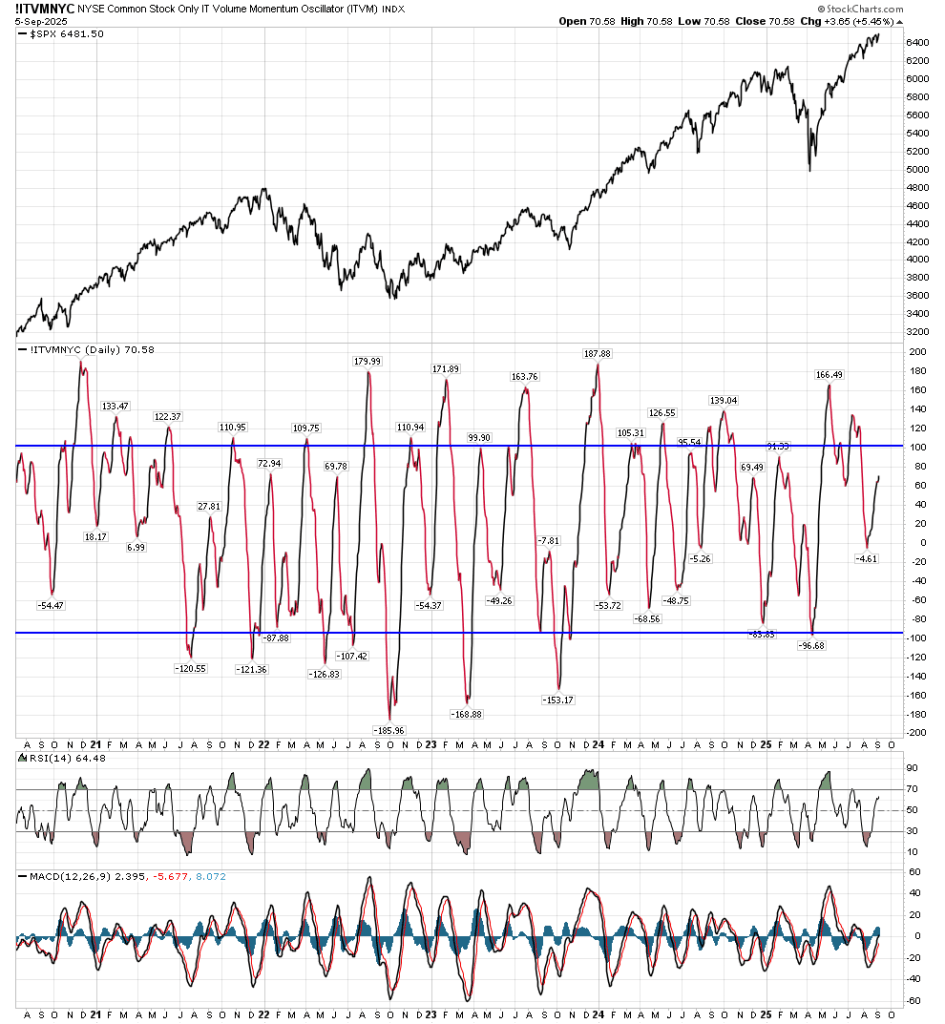
As this is an intermediate time frame chart, combine the view of the indicator with the RSI and MACD status. When an RSI below 30 regains and bounces above 30 at an !ITVMNYC low, it represents a fairly low risk environment. The fact that it bottomed recently at the zero line indicates a market that is still not showing substantial weakness.
I will be searching for a future entry point into equities based on my Daily T-Theory chart, as well as the above personal indicators.
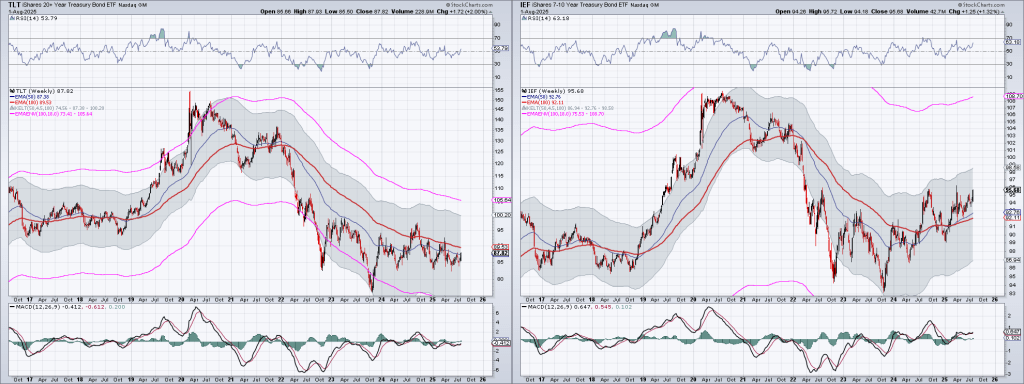
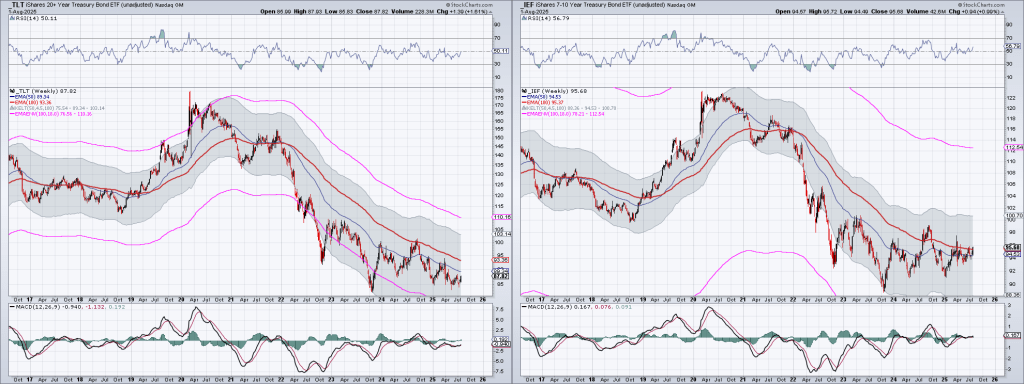
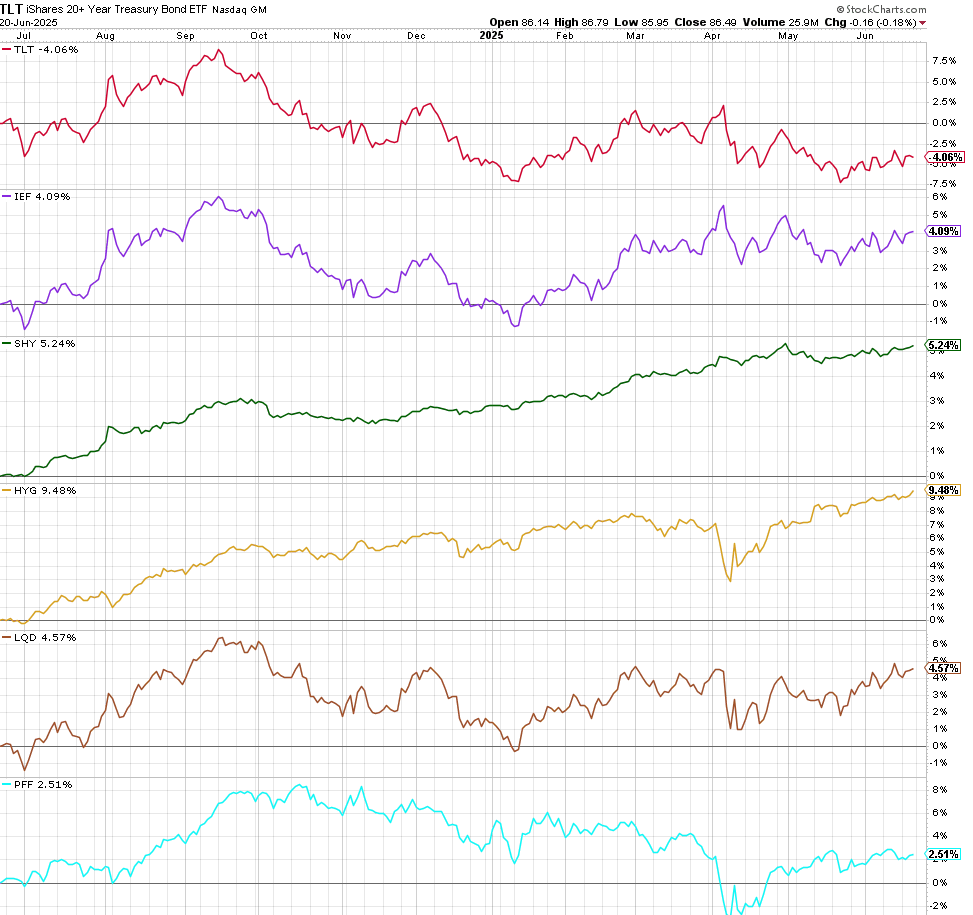
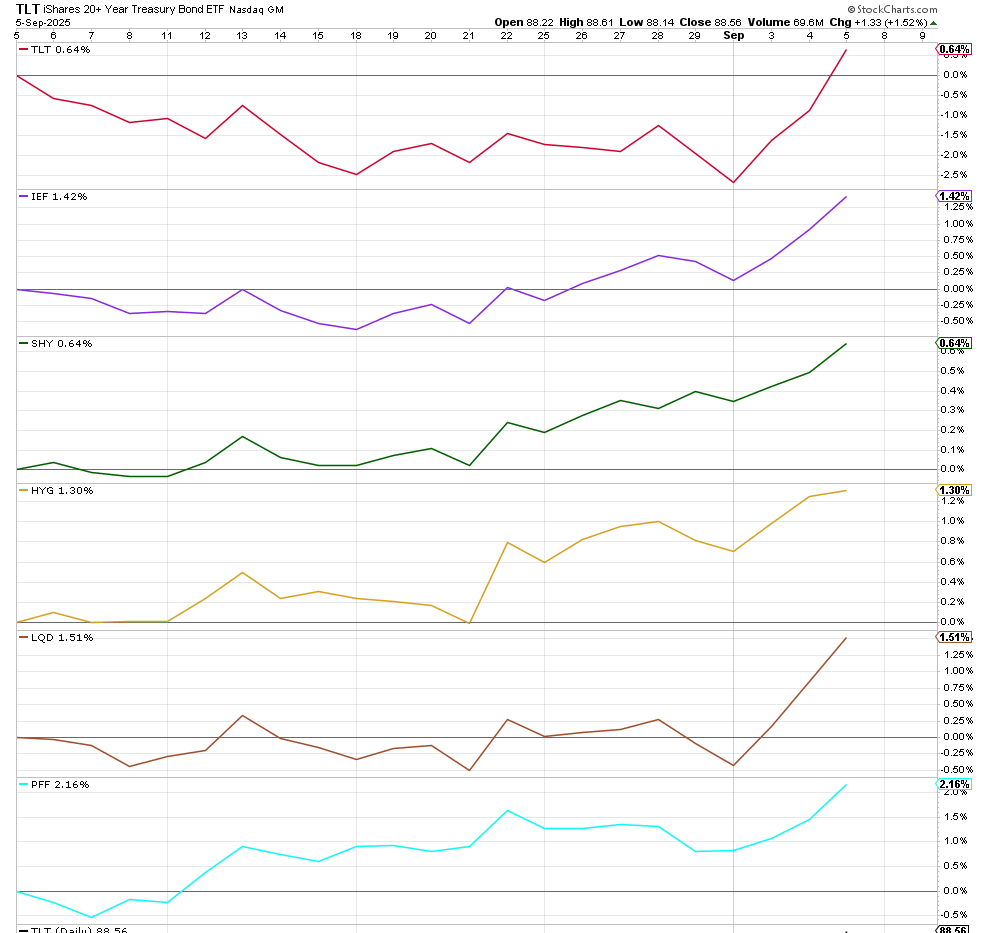
On another note, the bond situation is still an issue. I discussed my opinion that IEF would be a better choice than TLT at that time, and that has been the case. It has even exceeded the movement of the junk bond ETF HYG since then.
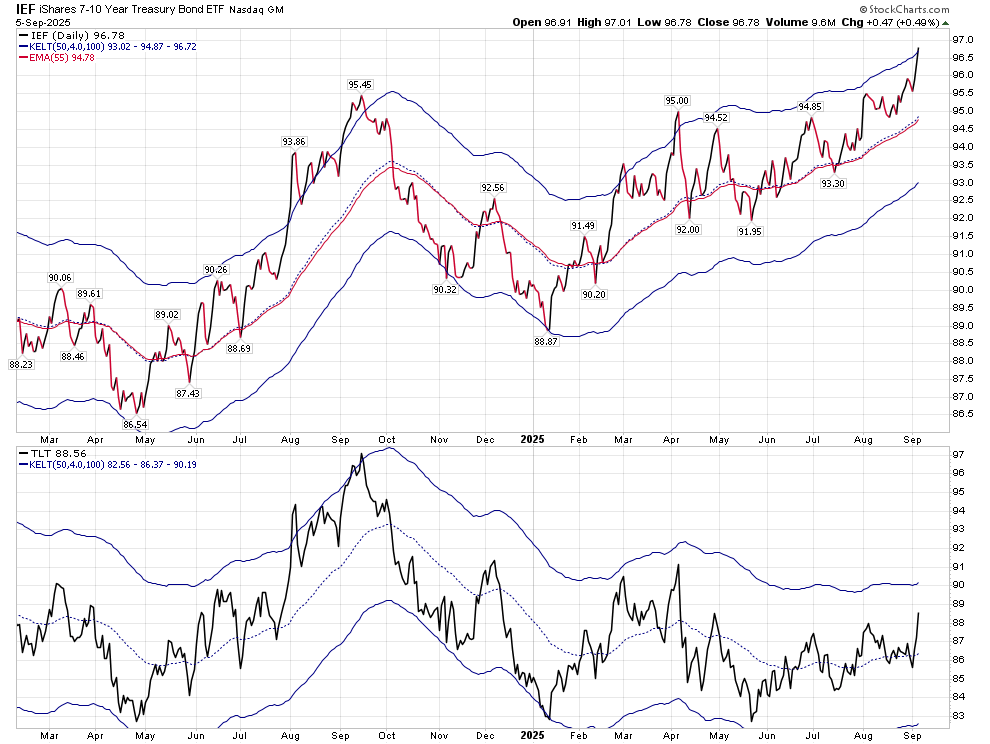
The above chart shows the difference between an upward sloping Keltner band and one that is basically level.
I am still leery of investing in long term bonds, and have most of my bond assets in short term bonds that roll over, or ETFs that don’t extend beyond 7 years, with most of that in the 1-3 year range.
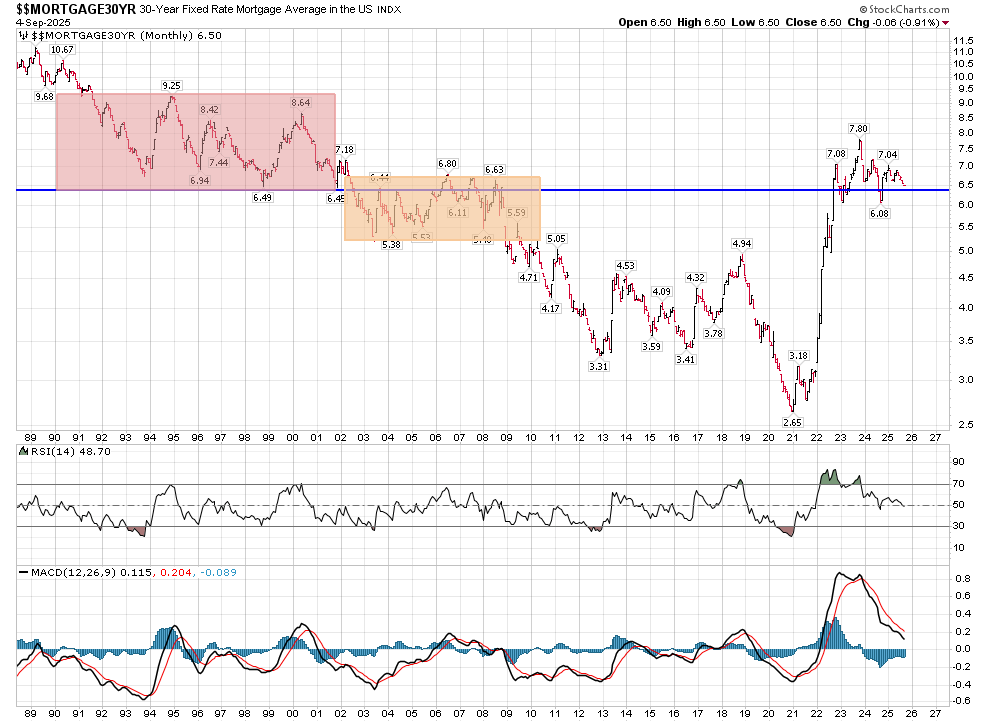
I could write more regarding what I see in the bond market, but perhaps I’ll do that next week. But I will leave you with a Mortgage chart that suggests we are at a level in Mortgage rates that could bring us back to a lower regime similar to 2002-2009, or stop moving lower as we are at support. Time will tell, and it’s near a critical decision.
Till then,
Stay safe.