Last week I projected a new T had been formed, missing one key ingredient–The Volume Oscillator and the McOscillator needed to move above the last descending peak reached before it moved below the zero line. I expected that momentarily, and that has still not occurred. We were also hoping for the VO and McOsci to stay above the zero line to create a Complex Bullish move, which they obviously have not.
I’ve changed that to a T not yet confirmed. I remind you that the VO shows a lower low than the center point of that new T, but it will be revised Monday by StockCharts. Right now, the McOsci doesn’t show that lower low, but I don’t expect a new T to begin until we get a reading below -100 and reverse. That is my base case at this time.
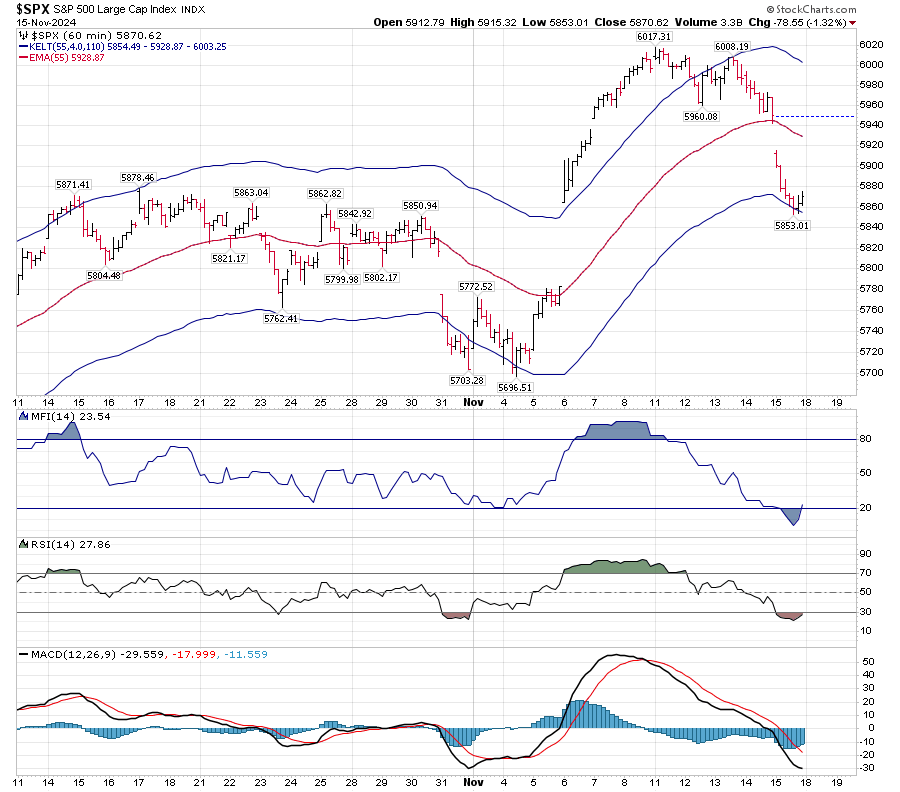
As we’ve moved below the midline support on the Bull Run chart I offered last week, I’ve returned to the normal Companion Chart. Support is 2% below where we closed on Friday–5765. There are two important things to note on this chart–RSI needs to stay above 50, and MACD is on the verge of crossing negatively on this Daily Chart.
For those members of elliottwavetrader.net, I had given warning not to short the market until the oversold readings on the hourly chart broke below their overbought readings on RSI and MACD. That occurred November 11.
Right now, RSI is on the verge of crossing above its oversold level, but MACD has a few hours ahead of it before that can occur. We hit the low on the hourly Keltner Band a few hours before the close, and stabilized. That becomes an area of support, with resistance at 5928 for Monday.
5928 is 1% above where we closed Friday. On the Daily chart, 5765 is 2% below where we closed. I’ve pointed out over the years that we must keep in mind these percentages, rather than point moves. In 2009, a 6 point move was 1%–now it is 8 times that many points to hit 1%. Do institutions and retail customers make plans based on small percentage moves? Should you? And yet, I offer these points of resistance and support because they will tell us the overall strength or weakness of the market, when used together with T-Theory.
Terry Laundry felt that when there is no T, the market is not in a period of strength and may offer no better return than the 10 year Treasury. What does that mean when Treasuries are moving lower? It may mean hold onto your pants–or it may mean we are setting up for a reversal. When your primary means of reading a market gives you ambiguous readings, you look to retain your principal, and lower your risk. I have recently hedged my bond position by shorting high yield bonds.
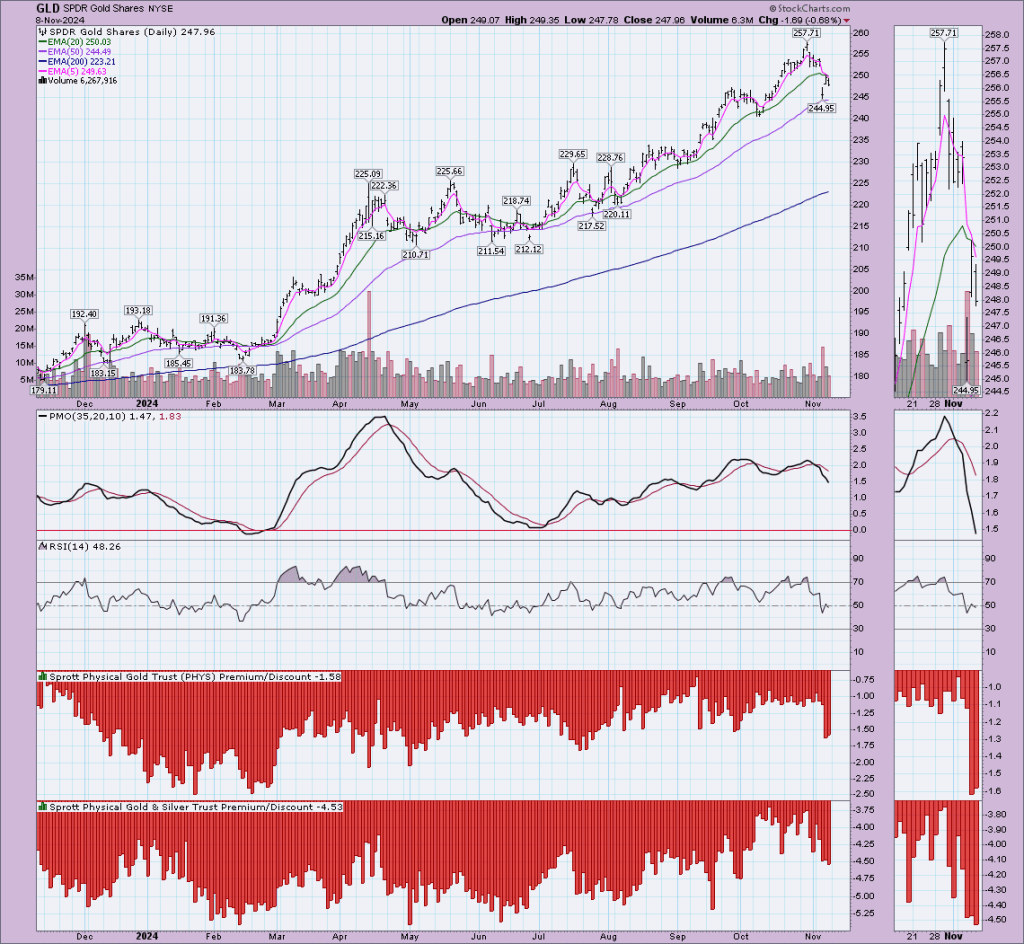
Moving on to GLD, I luckily had a short leash on my re-entry at 245. I have no position there at this time. It is coming into deeply oversold territory very quickly, but I have no intention to re-enter. Should we hit 228, I will reconsider.
Most of my time is not market-oriented these days. You can’t be a swing trader when you can’t find a swing, so posts will be sporadic, including those on elliottwavetrader.net.
Last week I stressed that we were looking for a low, expecting a positive formation out of that low, and that support existed at 5695. The low for the week was 5696, and from there we just took off.
This T has passed all of the parameters of forming a T, with one major exception–neither the VO nor the McOsci have yet passed the last peak prior to moving negative. In the case of the VO, we are about 2 points below. In the case of the McOsci, we need to surpass 22.21. As members of Avi Gilburt’s elliottwavetrader.net site know, I expected both of these events to occur yesterday. If you accepted Terry Laundry’s Marine anecdote (posted here several times regarding landing on a beach outgunned and with no support–with your friends telling you how wrong you are), you approached support with an open mind, and rather than fear that support, you embraced it. Especially as we were expecting the formation of this T sometime in the near future.
Those members of Avi’s site benefitted from my post of November 3 regarding how the market proceeded after the last 2 elections–2016 with a T immediately announced (on November 9) with a timeframe of 5 months, and a 2020 T (also announced on November 9) lasting through January 6 2021.
So what do we have now? We have a VO T reaching through January 5 (to be fully confirmed should the VO move above its last descending peak above the zero line). It came very close to doing that yesterday. Again, as mentioned last week, I have no indication that this new T will become a Bear T. Normal behavior would have the VO move back to the zero line once more before it moves higher.
Next we would like to create a Complex Bull structure, where the VO and McOsci stay above the zero line for a long period of time. That is a further confirmation.
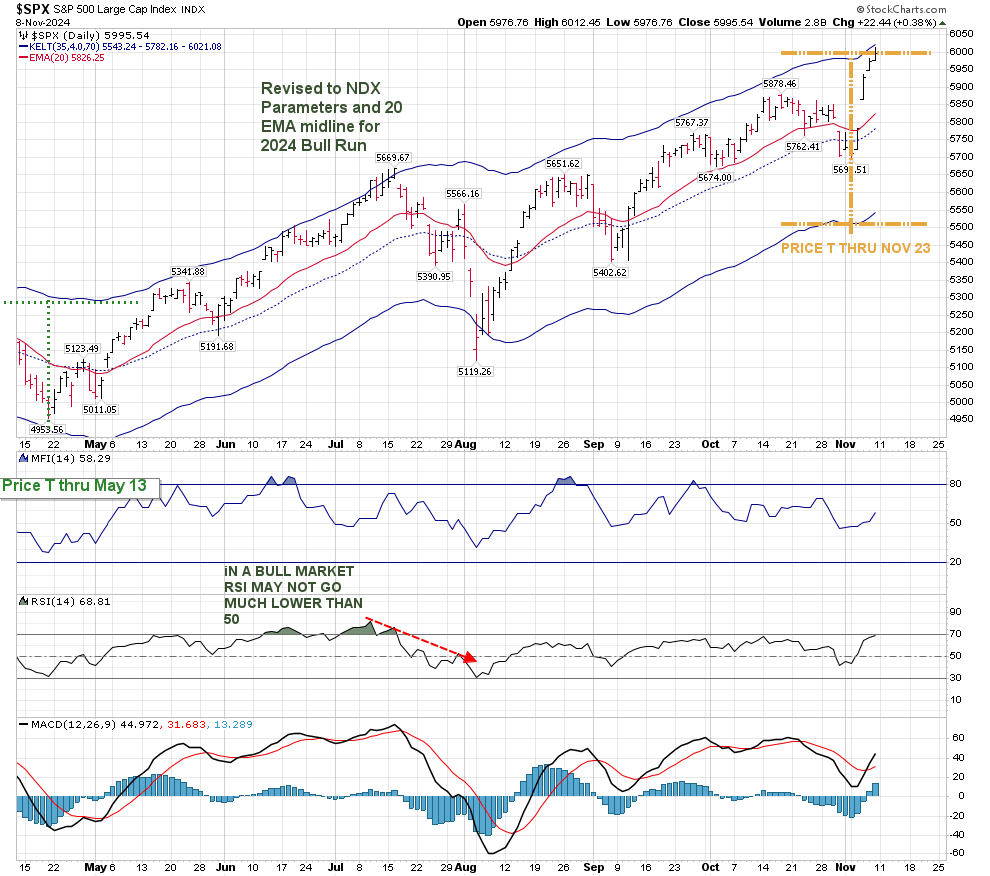
With this major move higher, we’ve moved back to where the 2024 Bull Run Chart more clearly defines the market’s support and resistance levels:
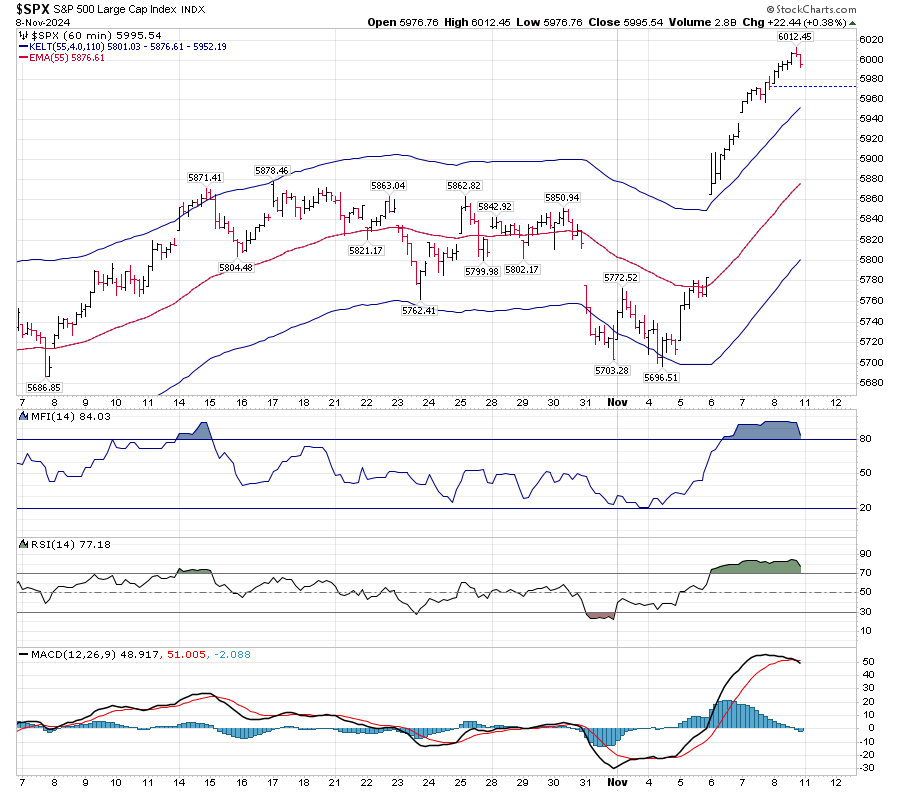
Similar to 2020, we have a shorter term Price T that should end November 23 shown above. I would suggest watching RSI and MACD for crosses lower, as the Hourly Chart shows them both in overbought areas. That being said, this new T is in its initiation phase, and the ability of the hourly internals to stay above their normal resistance levels should keep one from expecting a deep reversal.
Without a deep regard for fundamentals, the T charts were calling for a movement higher soon. There may have been a ton of funds that were going to be directed into this market once the election occurred under any outcome. The market is always looking forward to new areas of growth and concern. Fear and Greed work the short term levers of equities, but we should always try to add a dash of hope.
Keeping this short, TLT was up about 1.65% this week. We still have more than a year to go in its positive T, but it is a slow moving boat, and I continue to expect that to be the case.
GLD was down about 1.7% for the week. I re-entered my GLD position at 245, after removing it at 252. We still have over a month on this T, however I am giving this a short leash. We weren’t able to break above the short term Moving Average which we hit on Thursday.
The main T-Theory chart is searching for a low that can initiate a rally in equities.
As mentioned on October 6, I was looking for a Point of Recognition around October 26-29. It began a day late, and continued through the next day. These PoR have been good for returns of roughly 3% when they occur. The high on October 25 was 5862, and the low on October 31 was 5702. The close yesterday was 5728.
We’ve since broken through the green line of support drawn on the McOscillator a few days ago. That dashed line is tentative, but I am looking for completion of a new low sometime within the next month. The longer it takes to reach that low and turn upwards, the longer the period of strength (that should follow that low) will last. At the moment, I have to believe that this new T will be positive. At the same time, I need to be wary of some weak internals.
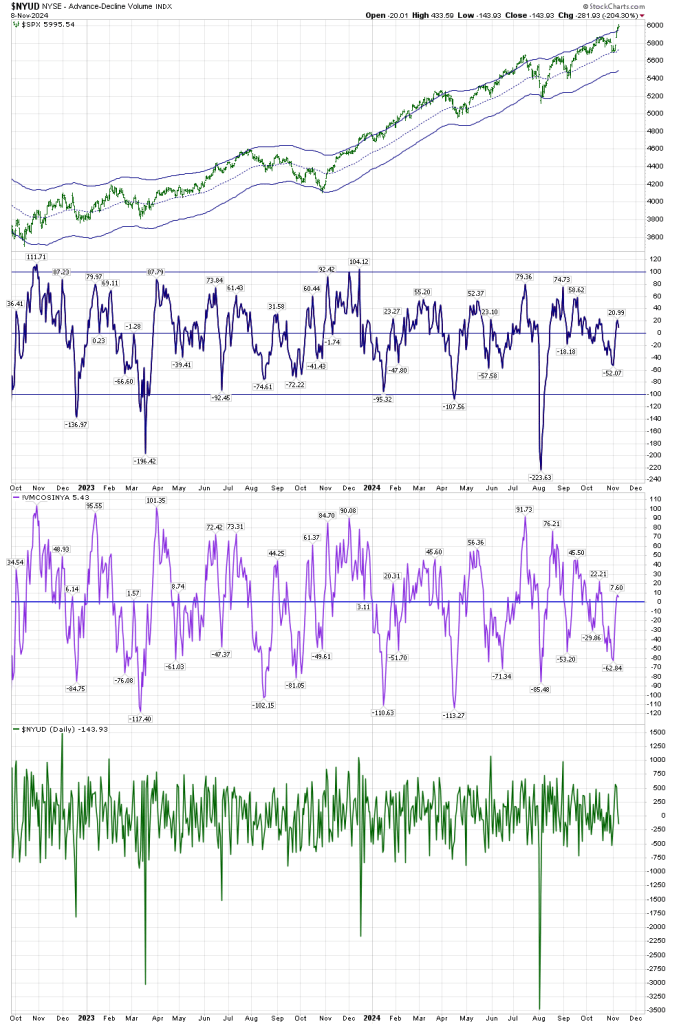
An area that’s been concerning me recently is the SPX A/D line. There are two points of concern. The first is that the A/D line itself has passed below the 20 EMA. It has been above that EMA almost every day since early July–even as the market weakened for a month. More concerning is the fact that the 20EMA has begun to point lower, and the 50’s trajectory seems to be moving in the same direction. The last time these two approached each other was near the beginning of July, and they still managed to kiss, rather than have the 20EMA cross below the 50EMA. A similar scenario would require weeks of–weakness, in my opinion.
And yet, we are hopefully creating a new T. Until Price support breaks down, we need to look for positive outcomes–for Price.
Where is that support? The middle of the Keltner band resides at 5695, and weakness on Thursday was stopped at 5702. That’s our first level of support. Breaking below that on a prolonged basis would lead us to reach for that secondary support of 5468.
The first sign of a new T forming will be a move on the Volume Oscillator below -100, followed by a rise above 30. For the McOsci, we’d like to see a low below -80, followed by a move above +22.
Using the rule of Complex versus Simple Structures, a V-shaped recovery using the above numbers from a low creates a Simple Structure, which should create a normal T. Should we malinger below the zero line, crossing and failing to move above zero, we could create a Bear T.
I was stopped out of my GLD position on Thursday at 252.
I’ve enjoyed riding this T (which still has more than a month to go). My initial suggestion of this T came in a post of July of 2023. I was stopped out of that, calling it a failed T. I re-entered it in February, around 182. I closed my position at 198, thinking I had a pretty good run, but was “forced” to re-enter when 212 became support. The 2% drop on Thursday triggered my stop.
I consider myself the opposite of a gold bug, and perhaps that’s why I’ve been relatively successful in trading it. If you look closely at my T chart, we could move as low as 227 to hit its support at its Optimum Moving Average, or we could go the other way, and move to 275 before we move into a situation similar to that of the last time GLD exceeded its envelope in the second half of 2020.
A reminder–these charts are based on those offered by Terry Laundry. He suggested a 20 year T in Gold, beginning in 2000, and ending in 2020, while also predicting a top in Gold in 2011, which gave us a 4 year lull before Gold topped out in 2020, as predicted.
I’m not prepared to discuss Bonds in depth this week. But I will leave you with a chart showing that after most Quantitative Easing announcements, TLT fell for 4-6 months almost every time. Yesterday was a horrendous date for those holding TLT. I am holding it now, and will continue to do so for the foreseeable future. My cost basis (after hedging from 100 to 94) is about 93.
There are those who must hold 30 year bonds.True bond holders want high short term rates to protect their capital from the effects of inflation. But of course, any holder of these bonds must compartmentalize the fact that the amount of debt carried by the US is absurd, and will probably never be repaid. In fact, my only comment about the current situation is that in 2016,Trump suggested that we should renegotiate our Treasury debts.
Trump explicitly ruled out renegotiating the debt. But he also glibly spoke of “[making] a deal” and appeared confused about key economic concepts related to debt…
The quote that triggered the original story—and much of the handwringing—came after Trump appeared on CNBC and spoke about his experience with debt in the business world. Then he said: “But I would borrow, knowing that if the economy crashed, you could make a deal. And if the economy was good, it was good.”
What did Trump mean when he said “make a deal”? Did he mean that a damaged economy could give the U.S. government leverage to force creditors to accept worse terms? CNBC’s Becky Quick followed up by asking if he meant renegotiating. “No,” Trump responded. “I think there are times for us to refinance. … And I could see long-term renegotiations, where we borrow at very long-term rates.”
In a matter of seconds, Trump went from opposing renegotiations to saying he could see long-term renegotiations. Deciphering a policy position from these sentences is impossible. Given the confusion here, Quick followed up again, “But let’s be clear, you’re not talking about renegotiating sovereign bonds that the U.S. has already issued?”
Trump responded, “No. I don’t want to renegotiate the bonds.” That’s Trump’s clearest statement in the entire CNBC interview: He explicitly ruled out renegotiating the terms of the debt. A second later, Trump said, “I’m not taking about a renegotiation, but you can buy back at discounts.”
Compartmentalization becomes harder, under these circumstances.
You may be surprised to have received this post, as it’s only 2 weeks since I closed my site. It’s still closed, but as my wife watched me reviewing the markets this morning, she suggested I send this to my email followers. I’m doing that, but the site remains closed. I will be posting this on elliottwavetrader.net.
Stay safe. Watch for the creation of the next T. Look forward.
As you may have noticed, I haven’t offered a new post for over a month.
Thanks to all who have read (and commented) on my posts. I hope some of the concepts created by Terry Laundry helped you navigate the market since my first post in January 2020.
To date, this site has been viewed almost 150,000 times. I’m humbled by that, and by the 300 readers who subscribe by email to this free site. Thank you.
These posts began as a corollary to posts I offered on Elliottwavetrader.net. My posts there will continue, but less often than before.
For those wishing to continue following the unmarked charts, Paula Burke maintains a chart list which follows Terry Laundry’s main concepts on Stockcharts.com at the following link: