
In my previous post of April 5, I noted that we were one step away from confirming the Volume Oscillator T which would extend until July 12. We received that confirmation on Monday April 6, when the VO and McOsci moved above their last peaks (prior to sinking below the zero line) and on Tuesday April 7 we opened at 6600. While that wasn’t the recent price low of 6316, it was a very safe entry into a very volatile market. We are now at 7398, and have captured 800 points or 12%. Our previous T ended October 20 of last year at 6735. Using the simplest form of T Theory, this produced higher returns than that of the SPX by 135 points, or 2%. Instead, investment funds were in short term bonds which improved our return. Using this system, we avoided the downturn from the January 30 high of 7002, if we did nothing else over the last 6 months. There were no concerns of FOMO or its opposite, which would have led us to buy high and sell low. While I presented a case for the possibility of a Bear T, there was never confirmation of that outcome. The present T-Theory Chart looks as follows:
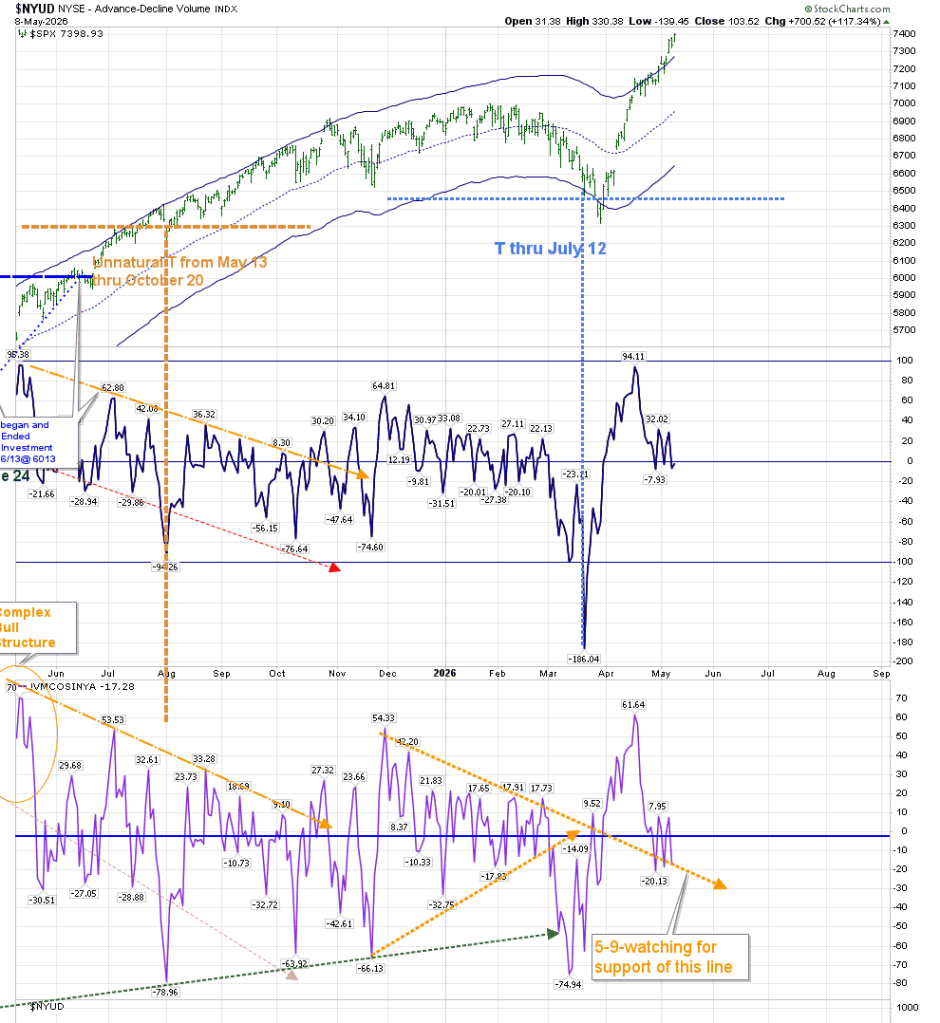
The Volume Oscillator and the McOsci acted exactly as it is supposed to act inside of a T–after reaching a high of 94, the VO returned to the zero line. That is standard procedure. The McOsci has been trying to stabilize similarly, and I am watching that orange trendline as important support.
The Companion Chart dealing with Price and technical indicators has had parabolic movement. It has created a Price T that should last through May 30.
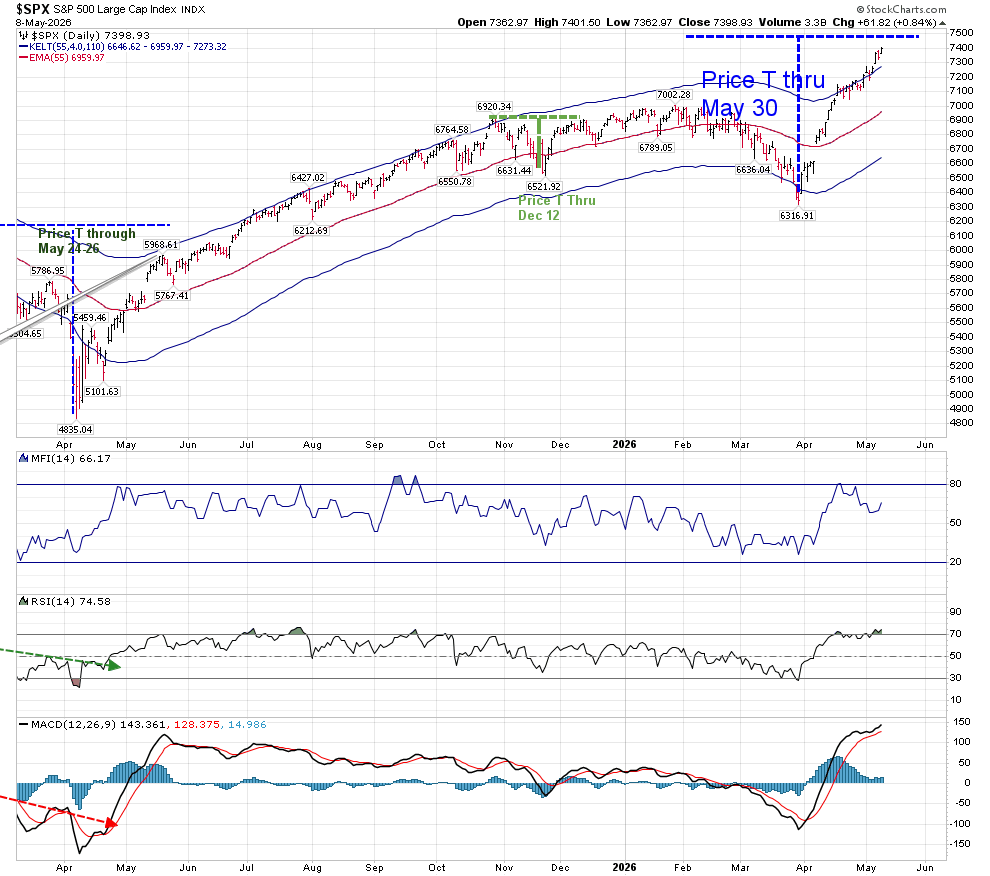
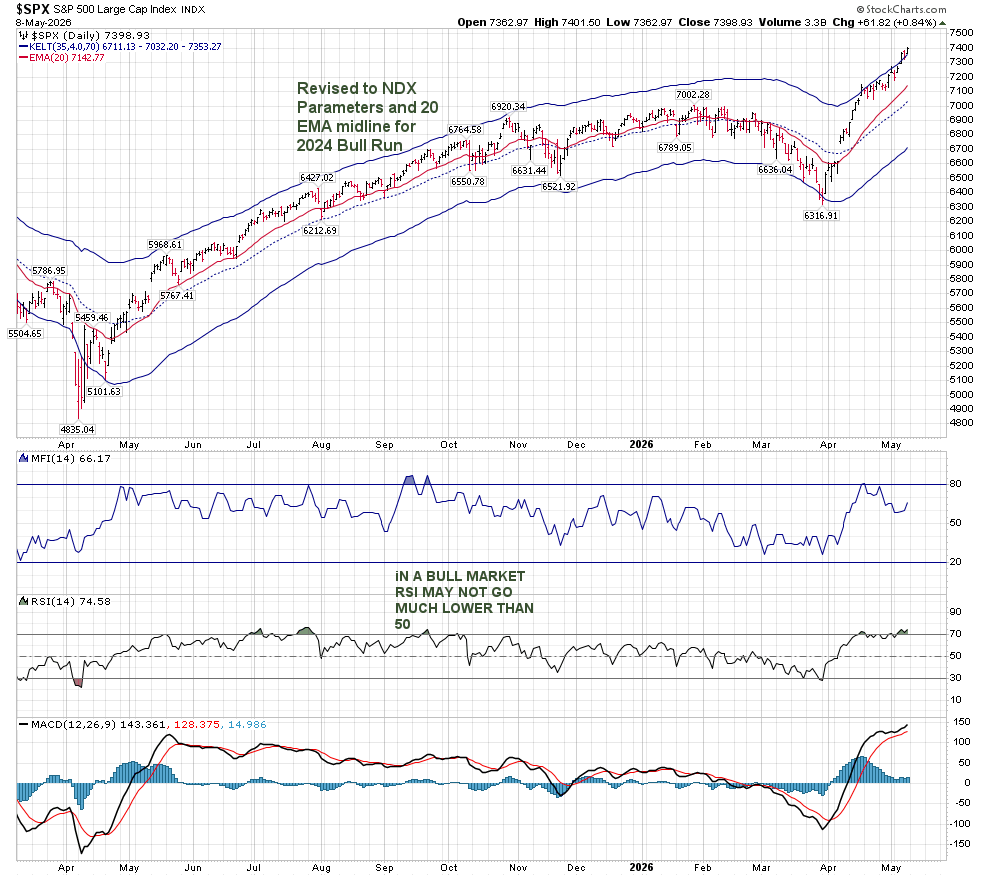
There is considerable strength showing in both RSI and MACD. While RSI is at overbought levels, it has remained there. MACD is positive until the fast black line crosses below the red slow line. Its height is inconsequential, even at this extreme. In fact, the strength in this chart has made me return to the 2024 Bull Market chart regarding Price Keltner band levels. The chart below uses the Nasdaq 100’s Keltner bands, and also comments regarding how RSI acts in a bull market:
The Price T is within the Volume Oscillator T, and may mean a lull around May 30 while the VO T continues.
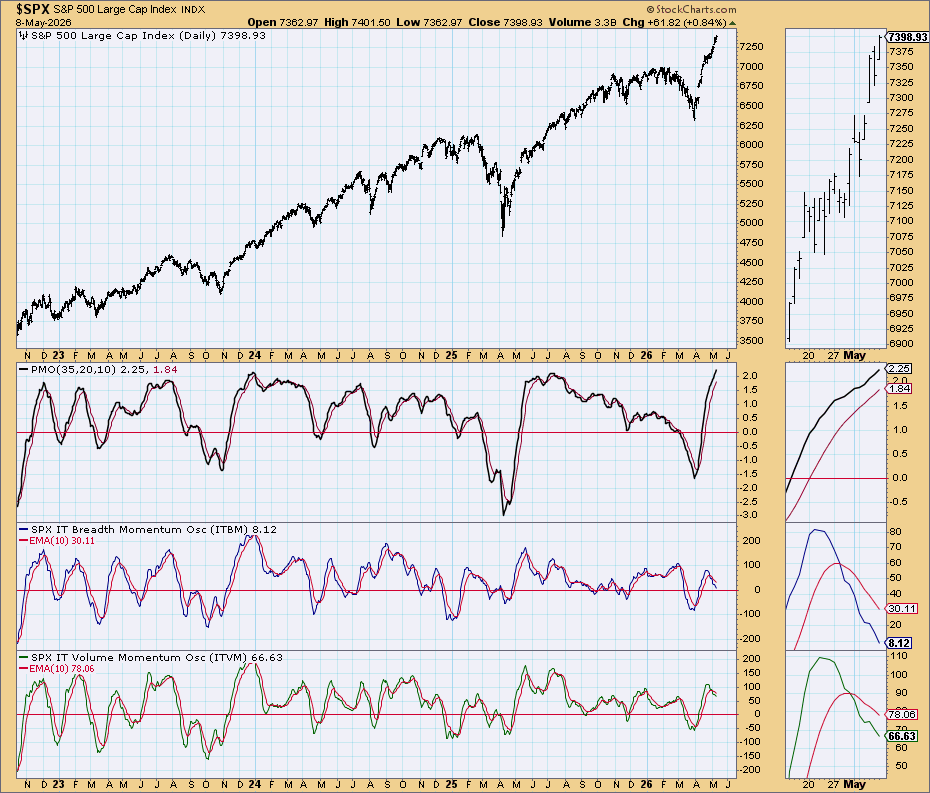
Other indicators are not as sanguine as stated above. The Simple Chart is showing a lack of Breadth and Volume momentum on an Intermediate time frame. But as we approach the zero line in Breadth, it is possible to reverse up again.
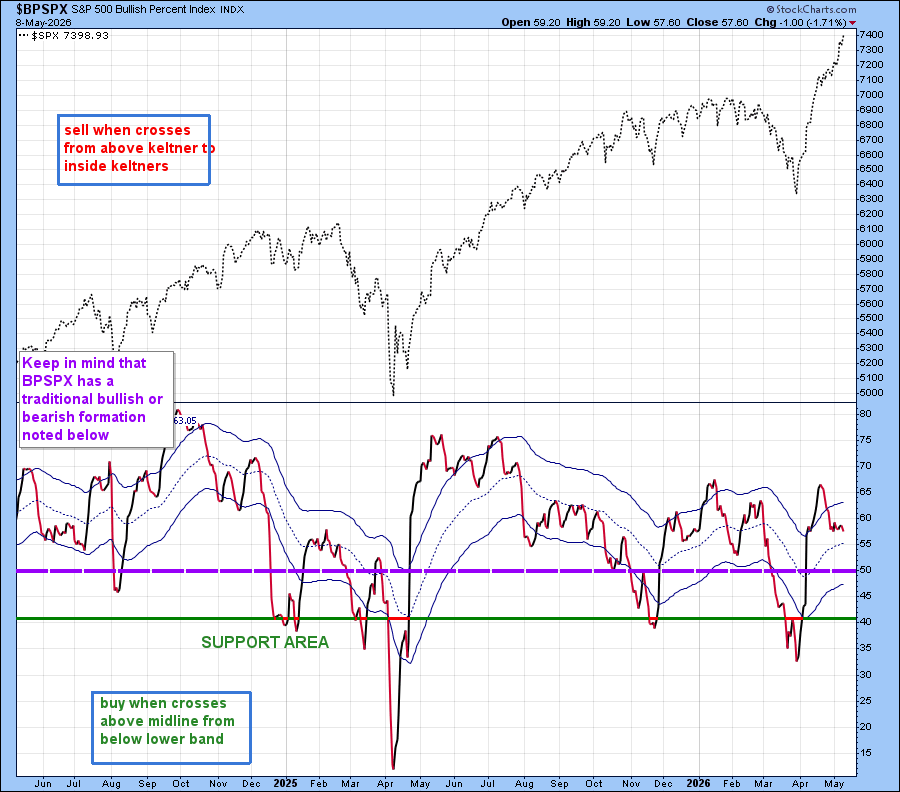
The Bullish Percentage BPSPX chart has moved from above the upper band to inside the band. That is a negative, but the Daily Price chart does not agree, as shown above.
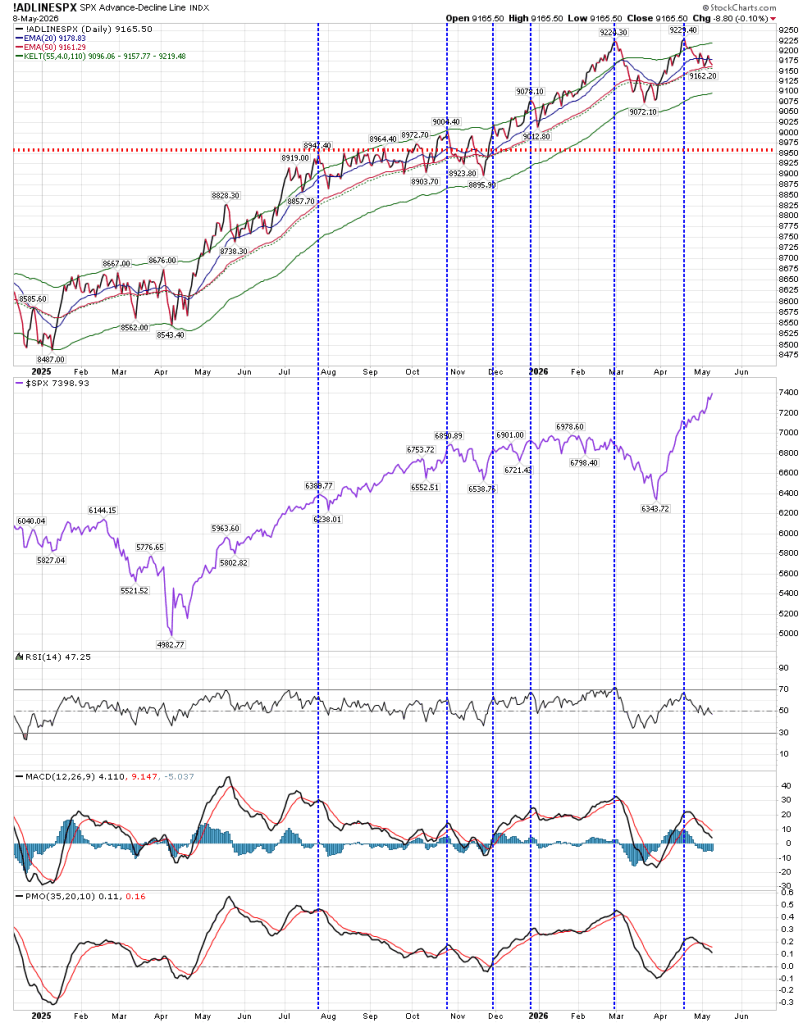
The Advance/Decline line has been retreating recently, which may also be seen as a negative. However it has reached a support level, and not broken it. We will worry more about it should it continue and break below 9160.
To summarize, I am expecting this period of strength to last until July 12, with a potential pullback around the end of this month. Right now, the charts are supportive of this outcome, but there are things to watch.
Best to your trading.
