It’s been 3 months since the Volume Oscillator T began, and it’s officially over. On April 5, I suggested that we were missing one final detail to confirm that T through July 12, and that T was confirmed on Monday April 6, when the VO and McOsci (McClellan Oscillator) both closed at levels higher than their last low before they travelled down to the late March low. Here is a copy of the chart that was presented at that time:
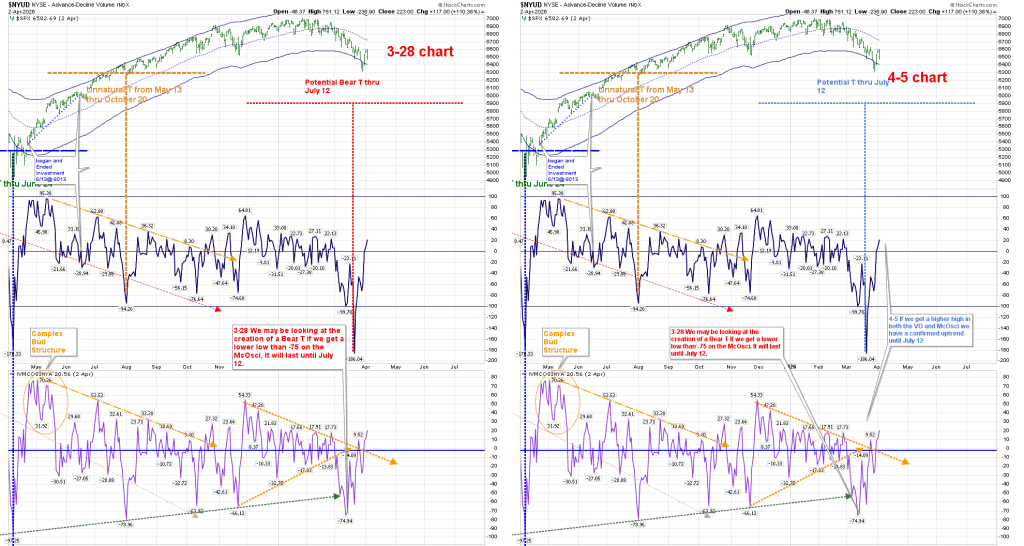
The above chart shows how we moved from a potential Bear T to a potential normal T. Assuming one entered this T on April 7, the initial move began at 6600.
My next post, offered May 9, showed that we were in a Price T that was destined to last until May 30. That post ended with the following statement:
To summarize, I am expecting this period of strength to last until July 12, with a potential pullback around the end of this month. Right now, the charts are supportive of this outcome, but there are things to watch.
I personally removed my position at 7430 mid-May, and posted here on June 6 that support was located at 7226. I ended that post as follows:
But the market has not broken down enough when reviewed with my tools to force the creation of a Bear T that hasn’t come out of its cave. I am looking for support to hold, and I will consider when to put money back to work.
I was rewarded on June 9, when we reached a low of 7232. As I wrote on elliottwavetrader.net on Tuesday, I closed my long position at Monday’s close, around 7530.
The total points gained on this was roughly 1100 points, or 16%, which outshines the SPX return for this year. The question is–what happens next.
At this point it’s not clear what happens next. While sometimes we have a sharp decline after a T ends, that’s not a necessary outcome. Magic T’s (as Terry Laundry called them) represented a period of increased strength that would last equally long as the period before the Market reached the low that eventually is called the Centerpoint of the T.
Copying from the T-Theory Concepts page of my website:
The main concept of T-Theory deals with the Magic T, a concept which Terry suggested may be a natural law. Magic T’s offer a cash buildup period, followed by a period of equal time that provides market strength. The equal periods of Weakness followed by Strength can be visualized by the two sides of the ‘magic’ letter T. The left side of a T represents cash being taken out of the market, and the right side of the T represents the equal amount of time showing strength. Since the market historically goes up 70% of the time, finding these “50%” heightened gain periods can be very rewarding. During that strength, cash is being put to use in a cash distribution. When a T ends, expect the period of strength to end, and for the return on equities not to exceed that of the ten year Treasury.
There are very few signs of imminent collapse to this market, outside of geopolitical or unforeseen (by me) financial crises. Can they occur? Absolutely. But where are we on the charts?
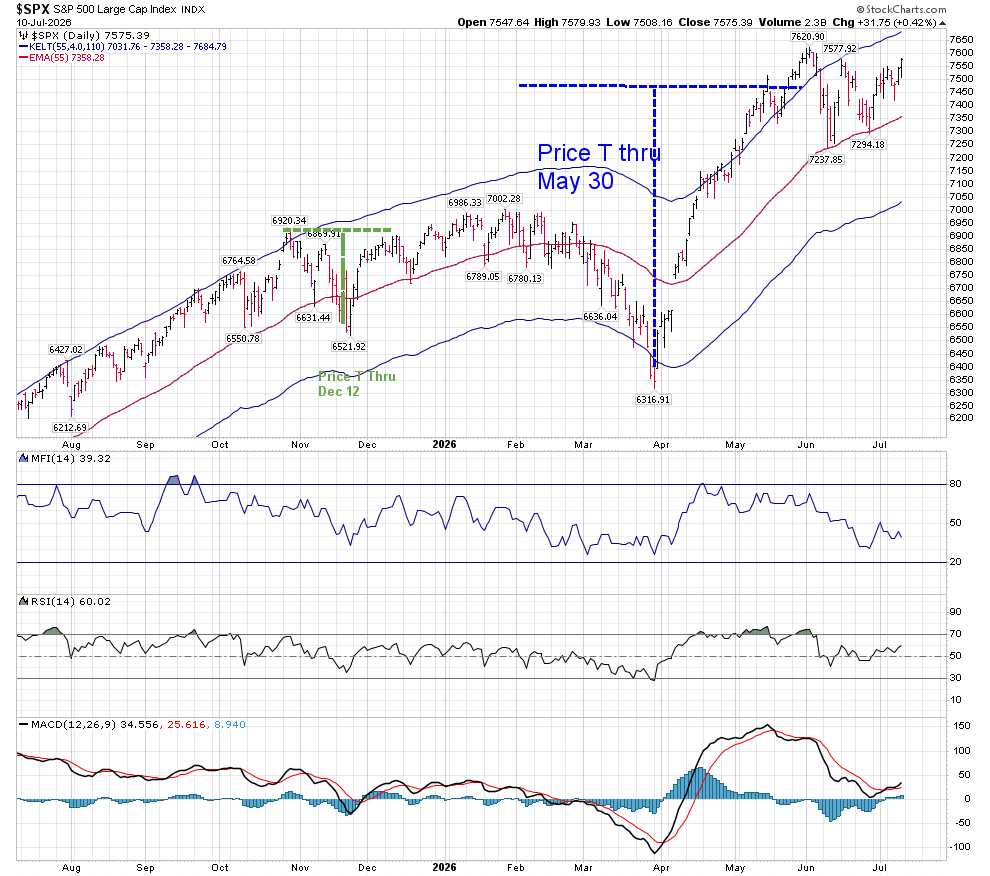
The present daily T-Companion chart (which I use to search for Price T’s) is showing RSI and MFI to be consistent with a continued rise. Money Flow is unable to move in to a positive–above 50–reading. Resistance is 7686, and support at 7360.
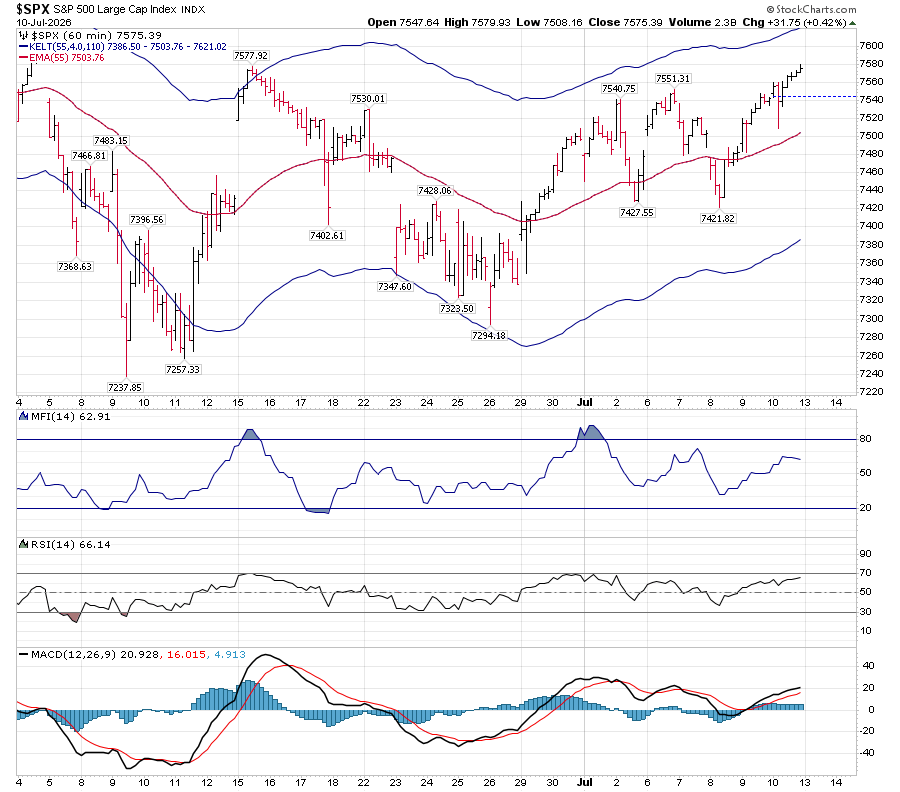
The hourly chart is not overbought, although it’s headed that way in terms of RSI. The other short term indicators are also positive.
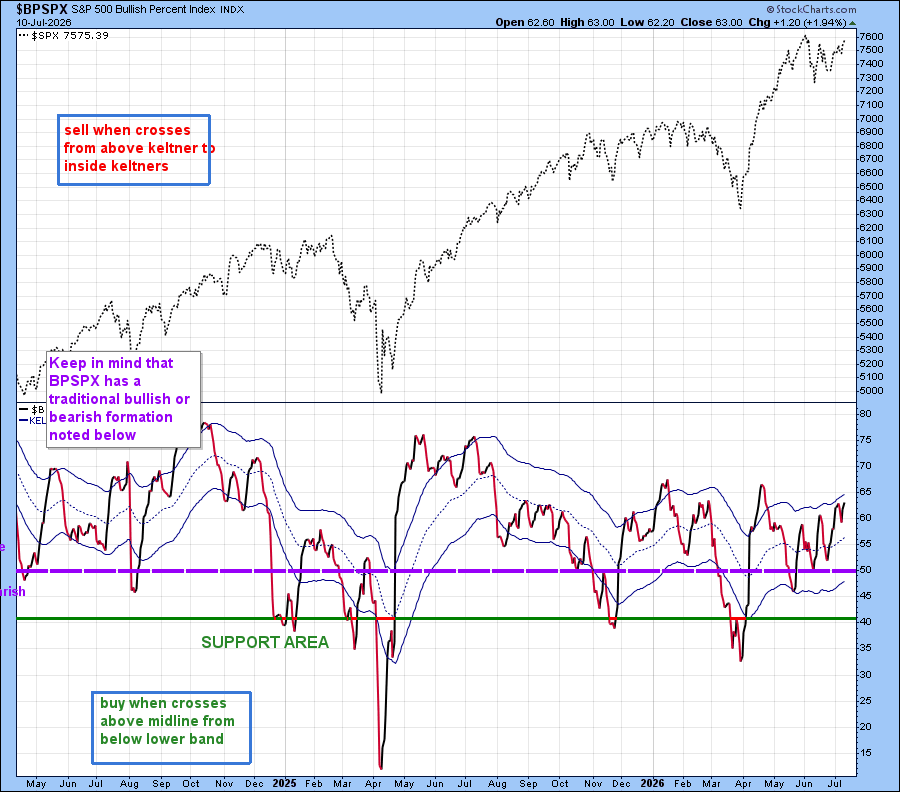
The BPSPX is at 63. Any reading above 50 is positive, on a traditional scale. The chart below shows that we have been moving steadily higher since hitting the bottom of the Keltner Channel.
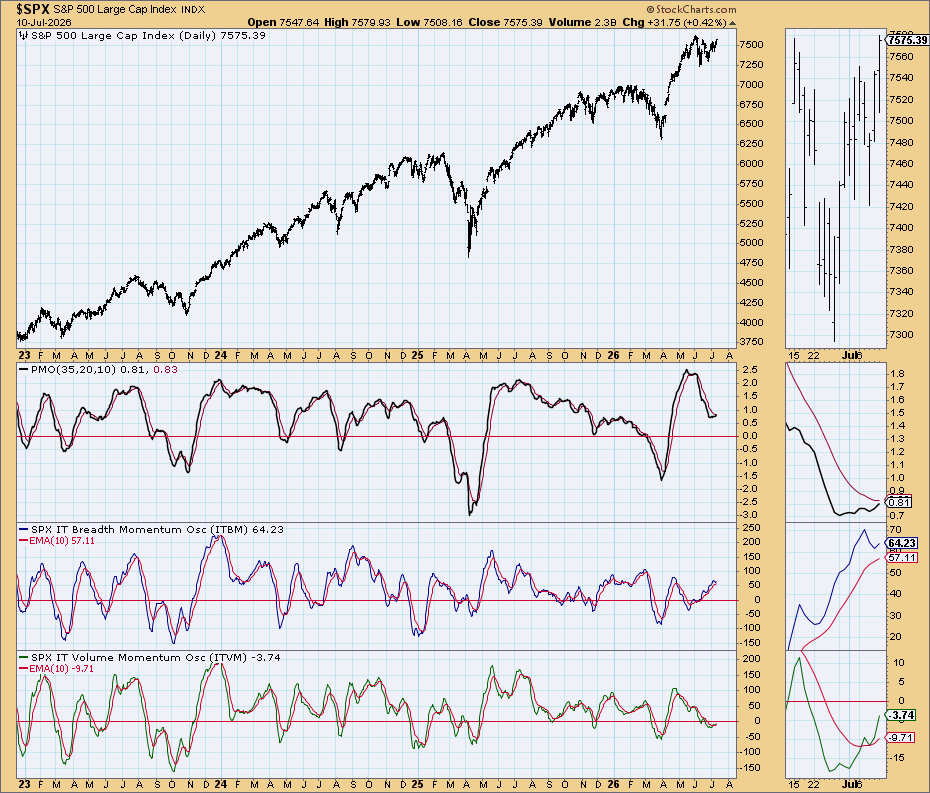
The “Simple Chart” shows that PMO may be about to turn positive, while Breadth and Volume momentum oscillators are both positive.
And now we come to the point where we look forward using the T-Theory concept created by Terry Laundry. Those who read this website regularly may remember that my first post of this year was March 7, when I suggested that we were looking for an upcoming low. My March 15 post was entitled “It’s Now or…”, where I postulated that we were near that bottom. And while my March 28 post failed to capture that low, I threw away my personal confirmation bias on April 5, asserting the T was most probably upon us. I wish that the present chart offered such a clear interpretation.
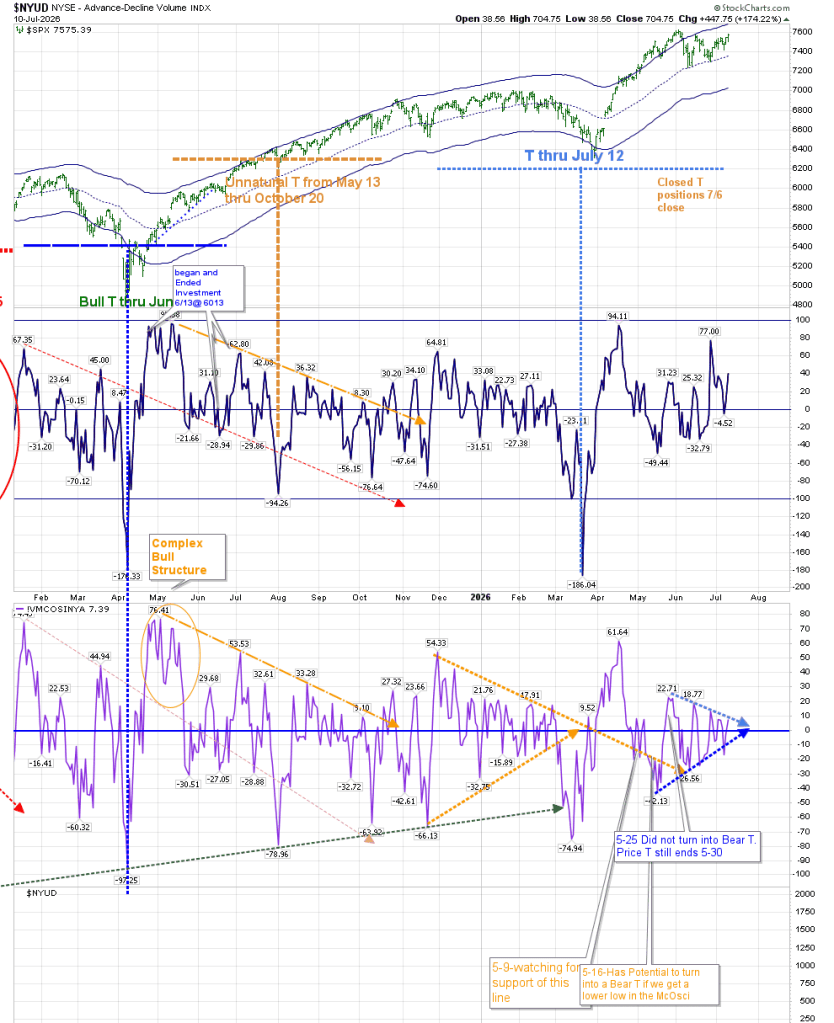
The present chart does not show weakness. It shows rising support on both the Volume Oscillator and the McOsci. However, there is a potential “blip” coming within 10 days. That “blip” is based on the Point of Recognition that is forming in the McOsci right now.
Using T-Theory, there is nothing other than Terry Laundry’s statement quoted above regarding expecting an equity return no greater than the 10 year bond until the next T is formed. Since short-term Treasuries offer a relatively high return right now, that is where my funds reside.
 T-Theory Thoughts
Huge thanks for your thoughts Bunker.
I’ve noticed that your unmarked VO chart that I always looked at here https://stockcharts.com/public/1172710/chartbook on your profile is no longer available.
Is it perhaps available elsewhere?
LikeLike
I have to assume that Paula Burke has removed the chartlist which she maintained for 14 years after Terry Laundry died.
You can use this one
https://schrts.co/fXzNBrzE
LikeLiked by 1 person
🤩🤩🤩 Thank you! I’m so grateful
LikeLike
Tks so much for your great update Bunker. Let us know when your next buy signal rolls along…meow. Cheers!
LikeLike