
It’s been a few weeks since my last post. Looking at where Price is today, it would be easy to say that not much has happened. We were at 7408 on May 16, when I wrote my last post, and today we’re at 7383.
That post discussed the Price T within the larger Volume Oscillator T. The Price T was scheduled to end on May 30, and we have had weakness since then, including yesterday’s 2.6% loss in the SPX. As I wrote then, I removed my long position at 7430, and mentioned that I would have no FOMO if the market continued to move higher. I had participated in a 12% rally, and was looking at weakness that could develop any time. Those who saw my numerous posts on elliottwavetrader.net announcing the end of the T, as well as the Point of Recognition visible on the Hourly VO chart, were able to ride the elevator down yesterday. While I participated in that ride, I closed my short yesterday. I am not discounting the Volume Oscillator T that is scheduled to end July 12.
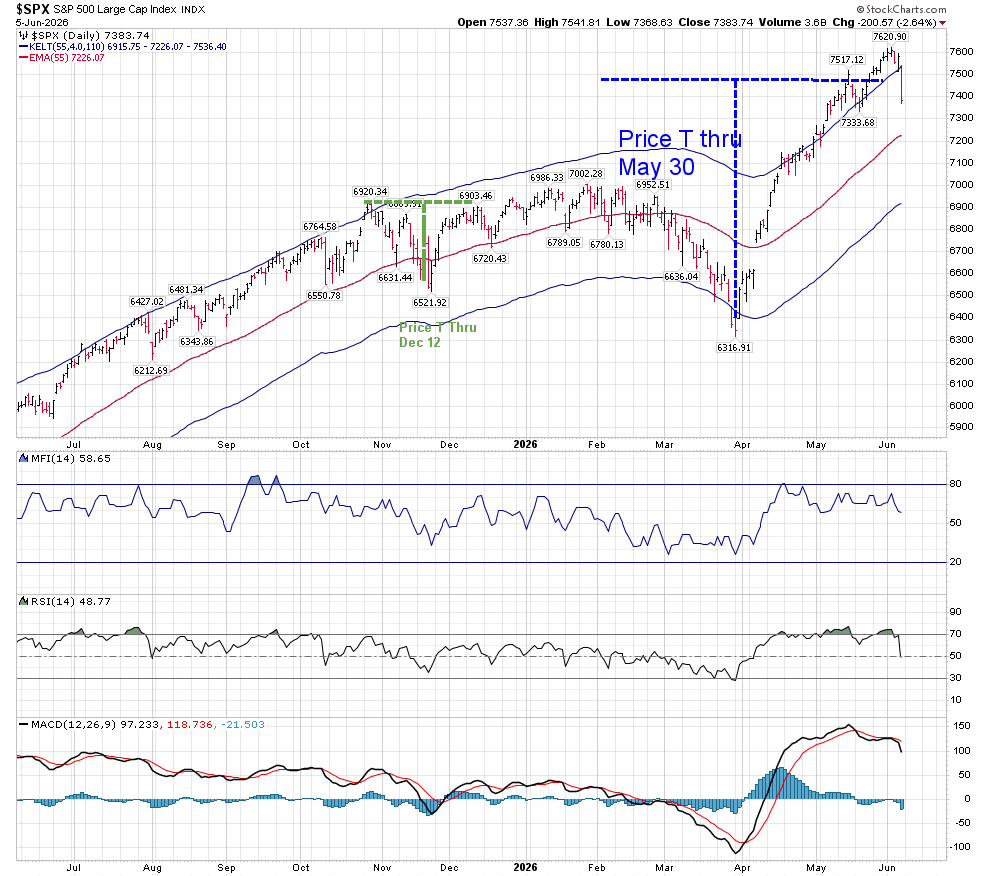
The above daily chart has RSI reaching a neutral area, and MACD has only begun to turn down from its overbought situation. There is no assurance that we have actually created a top. Should we move down further, support is at the mid-Keltner at7226.
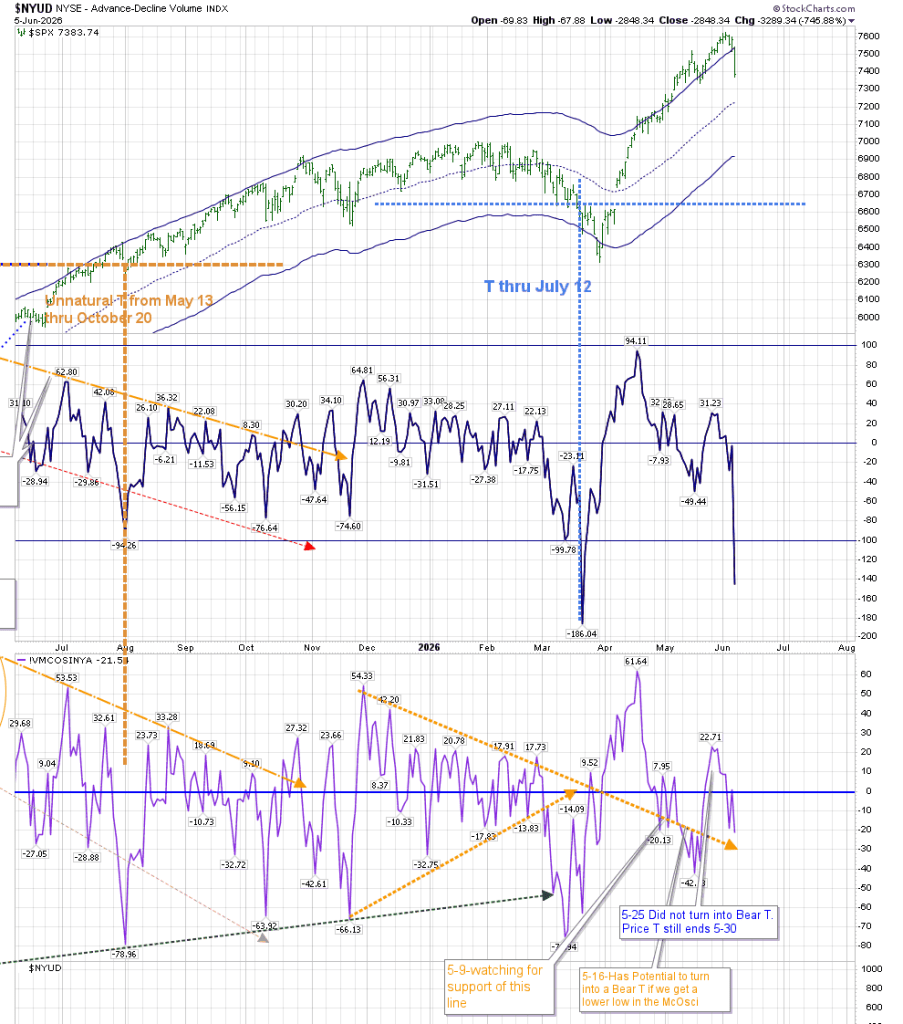
The above represents the marked T-Theory chart. While the VO is showing a deep move lower yesterday, that move should be corrected on Monday by StockCharts. The McOsci gives us a better representation of yesterday’s move, and you can see that it left us above the dashed orange line, which I am considering to be support.
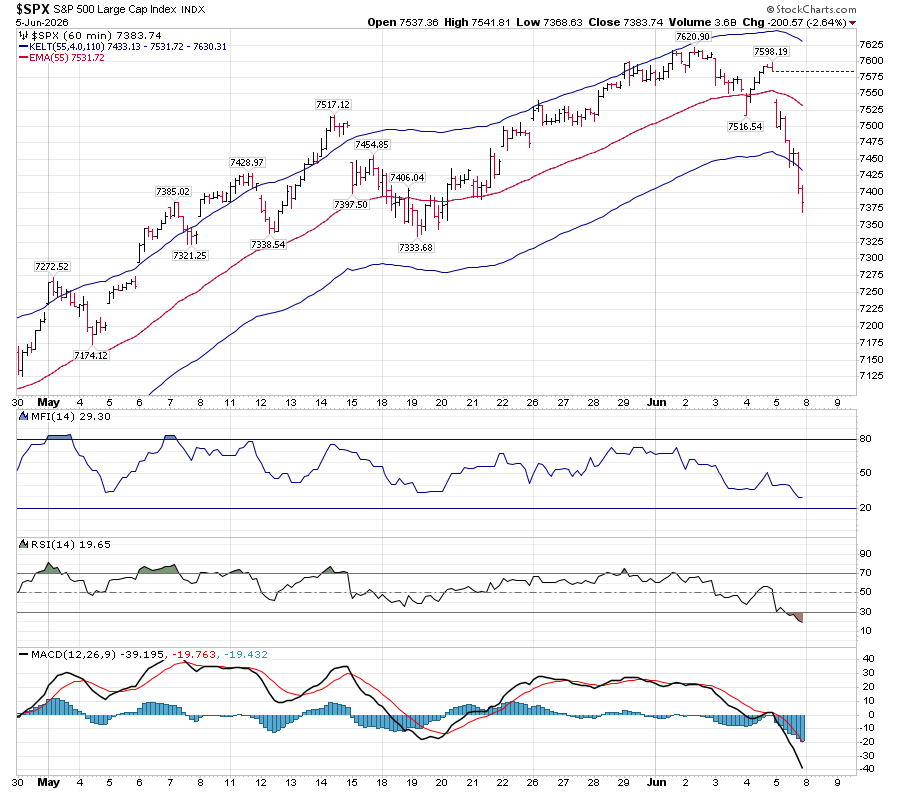
The Hourly Price chart has an oversold RSI, while MACD does not offer signs of an immediate reversal. I would be looking for RSI to bounce back above 30 before trusting longs, and that would pair with a rise in Price above the lower Keltner band. That lower band is now resistance:
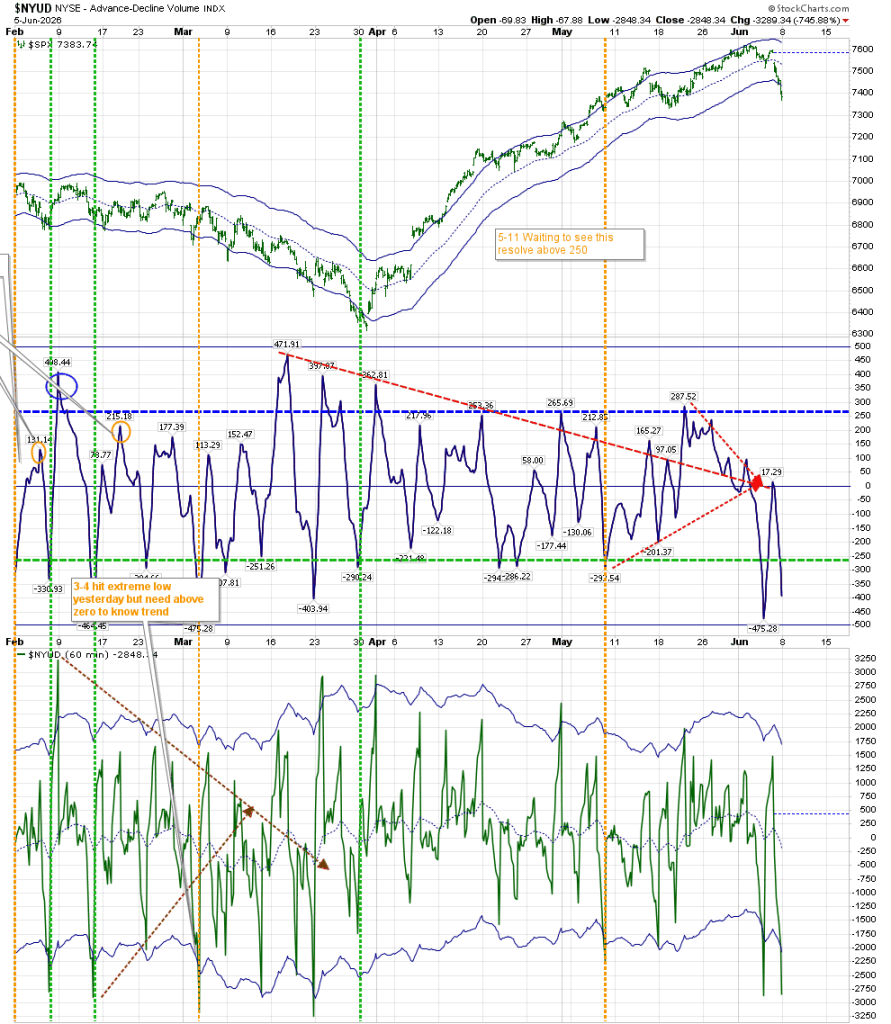
The hourly Volume Oscillator chart was the key to last week. We arrived at the point of recognition described by the red dashed lines. Passing below the green support line suggested a reversal was imminent, but that reversal was stopped by the neutral line. A move above 250 after such a low suggests an extended period of strength. A move that doesn’t get that high is susceptible to a reversal. A move just to the zero line creates a greater chance of Price breakdown. While we had that breakdown, we have once more reached a point where a reversal can occur. It can be just a dead cat bounce. We’ll see.
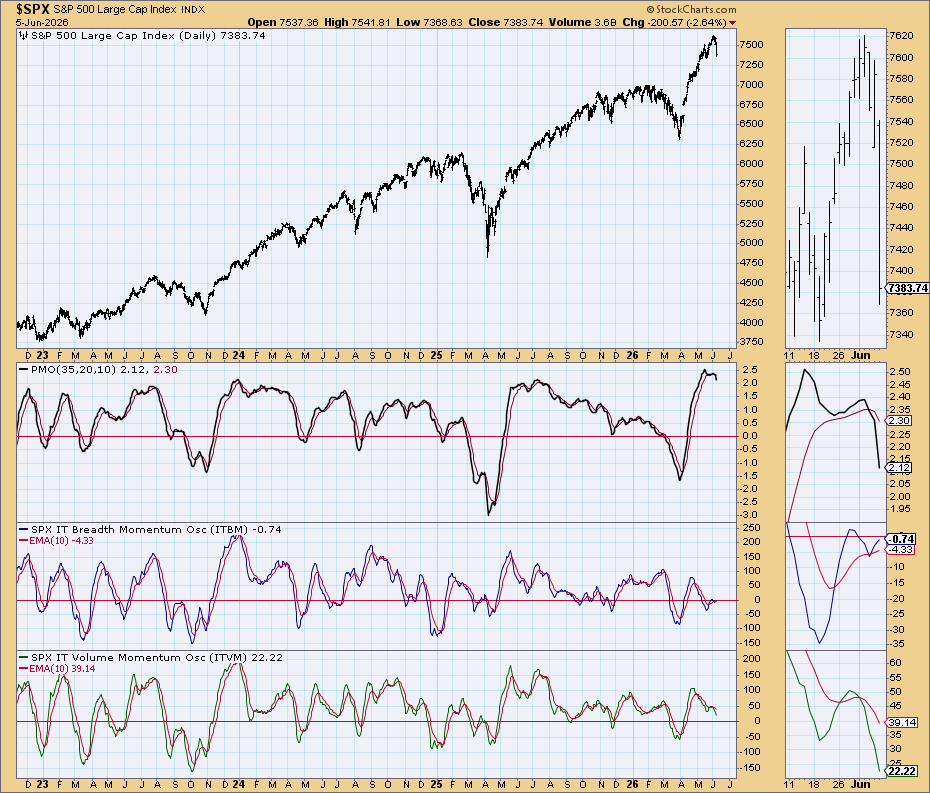
The “Simple Chart” shows PMO as having peaked. Breadth momentum is fairly neutral, and Volume momentum is still above neutral, while pointing lower.
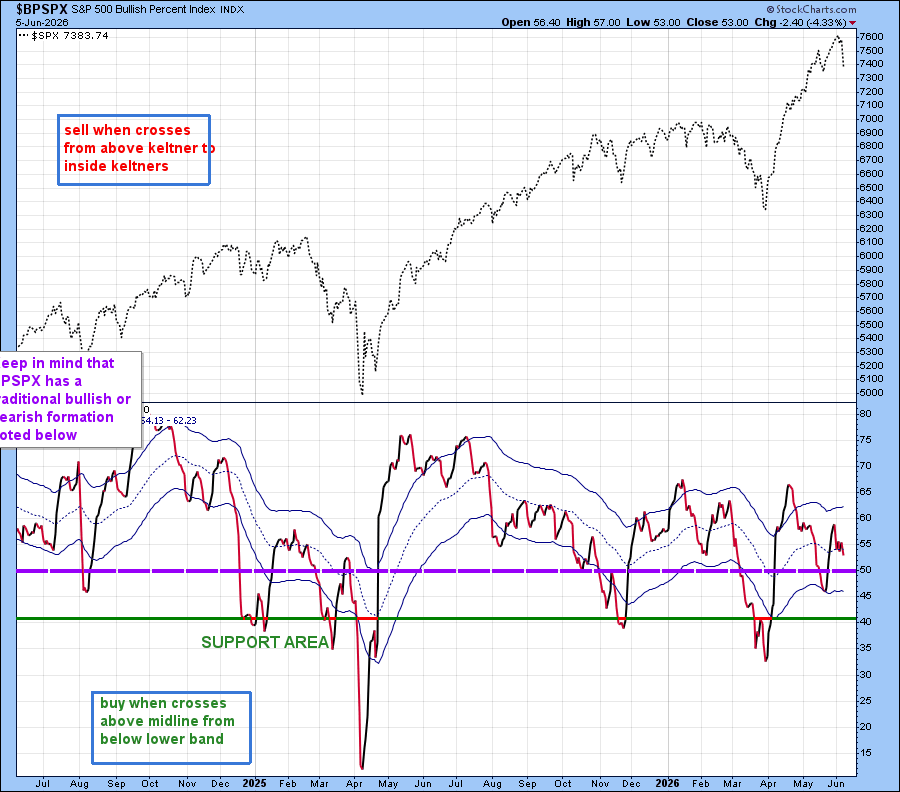
The BPSPX is not in buy mode, but it is above the traditional bullish number of 50.
Traditional T-Theory suggests that the July 12 ending marks the end of a period of strength. Finding and using those periods of strength are the true value of T-Theory. Readers of this site know that from the beginning of this T, I have been concerned that this can turn into a Bear T, should the McOsci and VO make lows that are lower than the T’s center-point which were created at the end of March. Time has passed, and for me the outcome is less relevant as I have profited over this period, and have no position at the moment. I can wait to see what the market offers. But the market has not broken down enough when reviewed with my tools to force the creation of a Bear T that hasn’t come out of its cave. I am looking for support to hold, and I will consider when to put money back to work.
Best to your trading.
 T-Theory Thoughts
Many tks Bunker for your update. Always to the point. Looking forward to future timely thoughts on the moves by the bull/bear. Meow….
LikeLike
Thanks Bunker!
LikeLike