In my last post (September 7), I began by suggesting that those who were expecting the worst might be disappointed. The main gist of that post was that many indicators were neutral within the context of an up-trending market.
While there have been no posts here since then, I posted on elliotwavetrader.net that I was looking lower for the week that just ended. That was the case, but the weekly movement lower was minimal. (On Thursday, I posted a chart at 6575 showing that we were only 12 points from hourly support, with an oversold RSI—the day’s low followed at 6569.) And now we have returned to a market giving less clues about the immediate future.
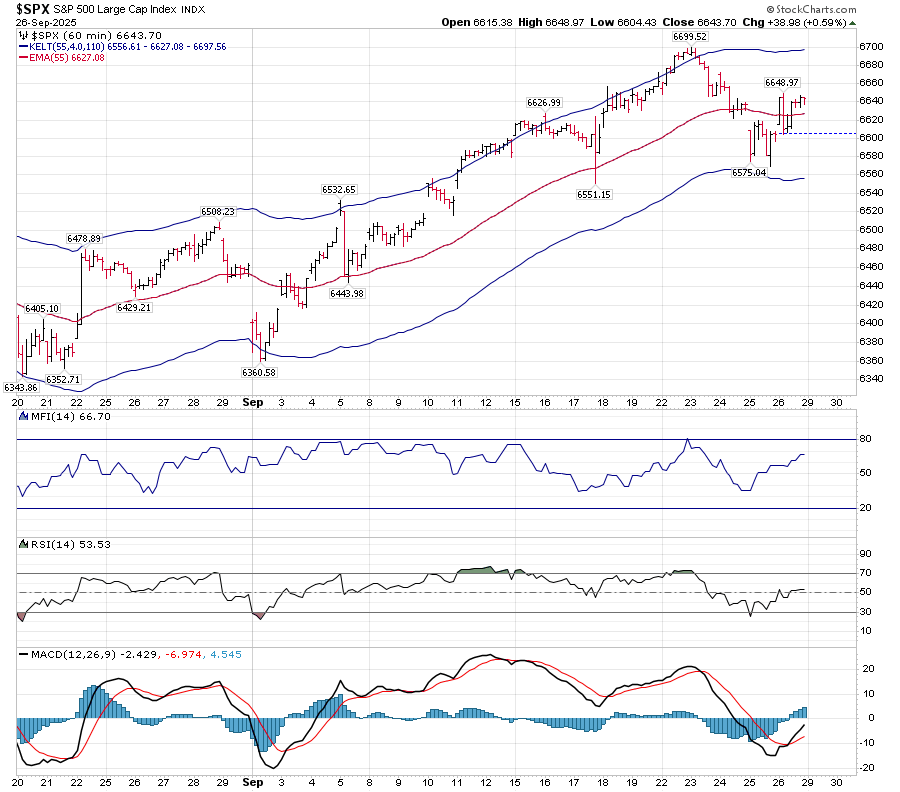
The hourly chart shows that we have moved above the mid-Keltner line. MACD is positive while RSI is neutral.
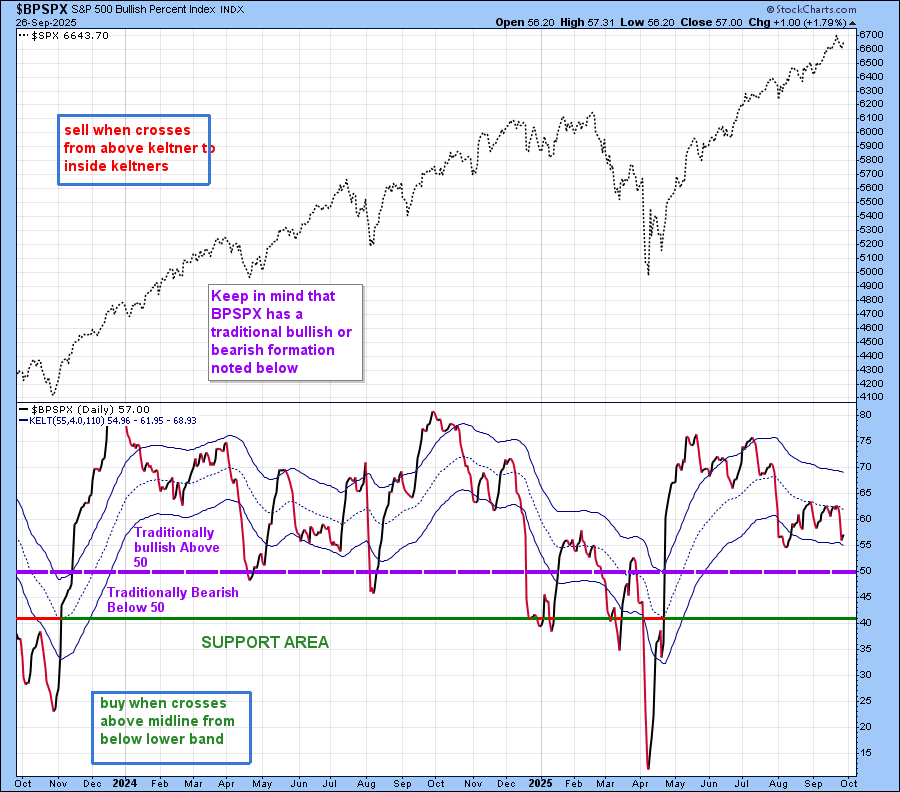
BPSPX has hit the lower end of the Keltner band, but is still above the bullish reading of 50. Moving to the bottom of this band without moving below it allows for a rally to begin, although it is not a given that it will do so:
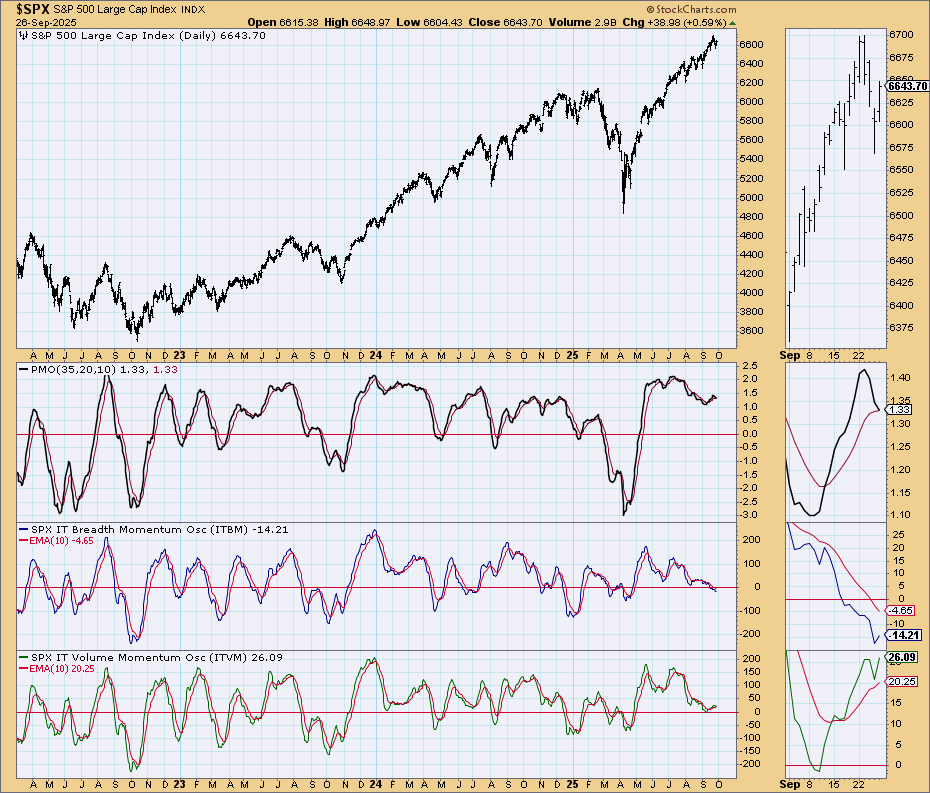
The Simple Chart is still showing negative Breadth Momentum, but the Volume Momentum has turned up from neutral support. PMO is faltering:
Of major concern to me last week was the Advance/Decline line. It was beginning to resemble the February/March readings, which led to the April swoon. While it held the 50EMA support, it has now moved slightly above the 20EMA reading. The next few days will be critical.

The fact that these EMA’s are now both in positive situations leaves me neutral on the present situation.
In last weekend’s post, I maintained my belief in the potential formation of a Bear T on the main T-Theory chart. That potential still exists. Following is last week’s chart to the left side of one showing the present situation:

While the Volume Oscillator will be adjusted on Monday, the McOsci is showing a return to the neutral zero line from a quick trip below. “Quick” trips create Simple structures. I’ve posted about the difference between a Complex and Simple Structure on this site since 2021, and a reference to it can be found in the T-Theory Concepts page. I explain there that I “borrowed” it from an article by Tom McClellan. These Simple structures create reversals. Complex structures, like the bullish one that has been circled ( for many months) above in May, create lasting moves.
In the present case, we will have to see early this week whether the McOsci can move above, and stay above that zero line. Right now, it is resistance. The VO, on the other hand, appears to have created that Simple structure, but we know that Stockcharts adjusts it during the following day’s trading. It should still remain below the descending trendline.
For those who don’t have the ability to chart the McOsi on its own, the “real” version of it can be found here.
It would be wrong of me to put a bias on the meaning of the information given above. I’m glad that I’m not obligated to spin these charts in any direction. You’ll have to make your own assumptions, as I am waiting to make my own. This week could be a critical component of that process.
