There was a movie released in 1976 called “The Marathon Man”, which had a scene where a diabolical dentist held a drill in the mouth of the protagonist, and asked “Is it safe?”. When he got an answer that he felt was untruthful, he drilled a hole in the hero’s tooth until he hit a root. The hero had no idea what the dentist was talking about, and tried to give the answer that he thought would stop the pain.
Bonds
The returns in the US bond market over the last year is shown in the chart below. The chart includes dividend distributions, which in this case, shows Price and Yield.
The winner in the above chart is HYG, which is a high yield bond ETF, but for the balance of this post, I’m going to disregard it and other non-Treasury ETFs.
The loser is TLT, which is an ETF that is based on bonds with at least a 20 year maturity. It holds 42 different bonds, with a duration of about 16, and an average maturity of roughly 26 years. A duration of 16 means that it should move 16 points with every one percent change in interest rates. In contrast, the SHY ETF holds 114 different Treasuries, with a duration of 1.87 years, and an average maturity of roughly 2 years. The middle ground in the above chart is held by IEF, a 7-10 year ETF. It holds 14 different Treasuries, with a duration of 7, and a maturity of roughly 8.5 years.
Looking at Price alone over the same period as the above chart, but removing their dividends, their Price performance is as follows:
A fundamental concept of the Price and Yield of a debt instrument is the risk premium–the value of the return of principal. In periods of high inflation, or principal devaluation, the risk premium on longer maturities will rise, relative to the risk premium on shorter based maturities. This becomes even more important if you are a foreign purchaser, who will have to convert the dollars into a different currency. And that brings us to the following chart:
Since January, there has been a roughly 10% loss in the dollar’s valuation. In January it was up over 5% from 12 months ago, but since then it has fallen almost 5.5% from its value a year ago. If you’re buying a bond with a maturity of a decade or longer, your loss on your holding has not been covered by the interest you have received.
From a May 2025 Congressional report, we learn the following:
As of December 2024, there was $28.1 trillion of Treasury securities outstanding, up from $20.9 trillion in December 2020, a $7.2 trillion increase (figures are rounded). During the same period, foreign holdings of debt increased by $1.2 trillion to a total of approximately $8.5 trillion. After staying relatively flat in dollar terms for several years, overall foreign holdings increased in 2019-2021, fell in 2022, then jumped in 2023 and 2024. Because the total debt has increased faster than the debt held by foreigners, the share of federal debt held by foreigners has declined in recent years. In December 2024, foreigners held 30% of the publicly held debt. Interest on the debt paid to foreigners in 2024 was $230.6 billion.
The link to that report shows the top 10 foreign holders of debt, and how it has changed over the last 5 years.
While I hope I’ve given you my perspective on the relationship between Time (maturity) and Price (value), I’m sure that you’d like to know what this is all about. It’s about confidence. To buy a long term debt instrument, one must have confidence that the future value of your principal is insured by an adequate yield to protect any potential loss in the value of your principal. But in addition to charts, one must think about the perceived future value. If you’re concerned that the value of your principal is being hidden from you by false narratives from the statistics you are given, you will want a higher return. It doesn’t matter what rate the seller of the debt offers to pay, you won’t pay 100 cents on the dollar for that debt if you can’t look at the books. Unfortunately, based on the killing of the messenger in Friday’s bad news regarding the jobs market, this is a variable that must be added to risk premium. Bond buyers (as opposed to bill and note buyers) will require greater yield to support their return of principal.
The Fed may suggest short term rates, but the bond market looks beyond that. The Treasury has been trying to weaken the effects of the cost to the government of high rates by issuing more short term bills and notes. They are in effect, trying to time the market. (In retrospect, more long term debt should have been issued in the 15 year’s preceding 2022.) Offering fewer Treasuries with longer maturities does keep the interest paid on them lower based on supply. But the risks of inflation and misleading information have increased recently. Spreads between short and longer term issuances will probably rise, in my opinion. I am heavily invested in 1-3 year Treasuries.
That being said, we must look at the charts to see where Risk and Reward offer potential.
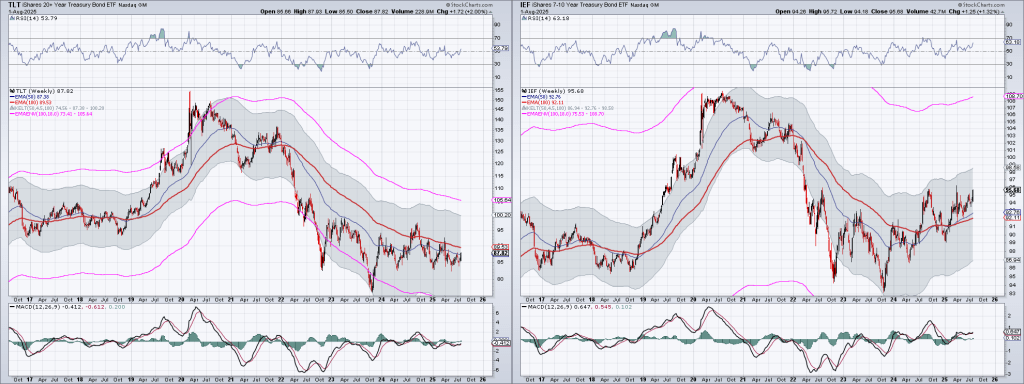
Here are the weekly charts of TLT and IEF using the Optimum Moving Average created by Terry Laundry:
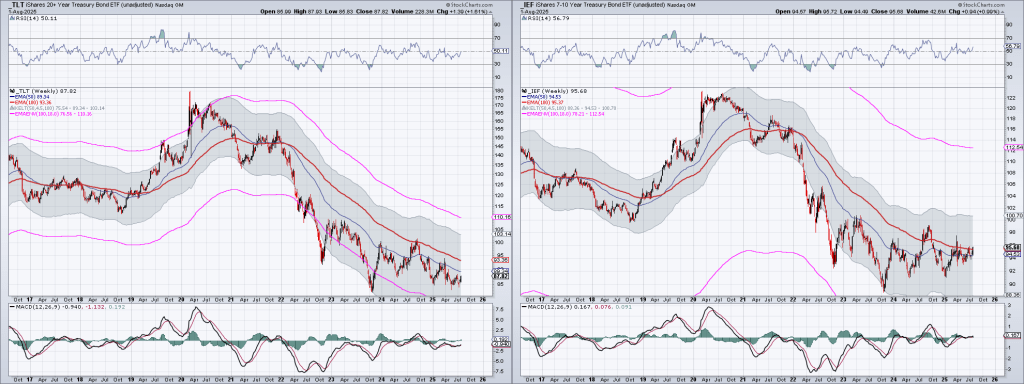
The following chart shows Price movement, removing the Yield:
All Treasury maturities do not show the same potential, and it’s my opinion that IEF will give a better return based on Risk to Reward. IEF has the potential here to break above its Optimum Moving Average, while TLT is still floundering. Why am I not invested in either one? My risk tolerance at this point is low, and a chart of SHY over the last year looks like this (the left side is Price including dividends, while the right side is Price alone):
As far as equities, are concerned, on July 17 I suggested one hedge equities with the following post:
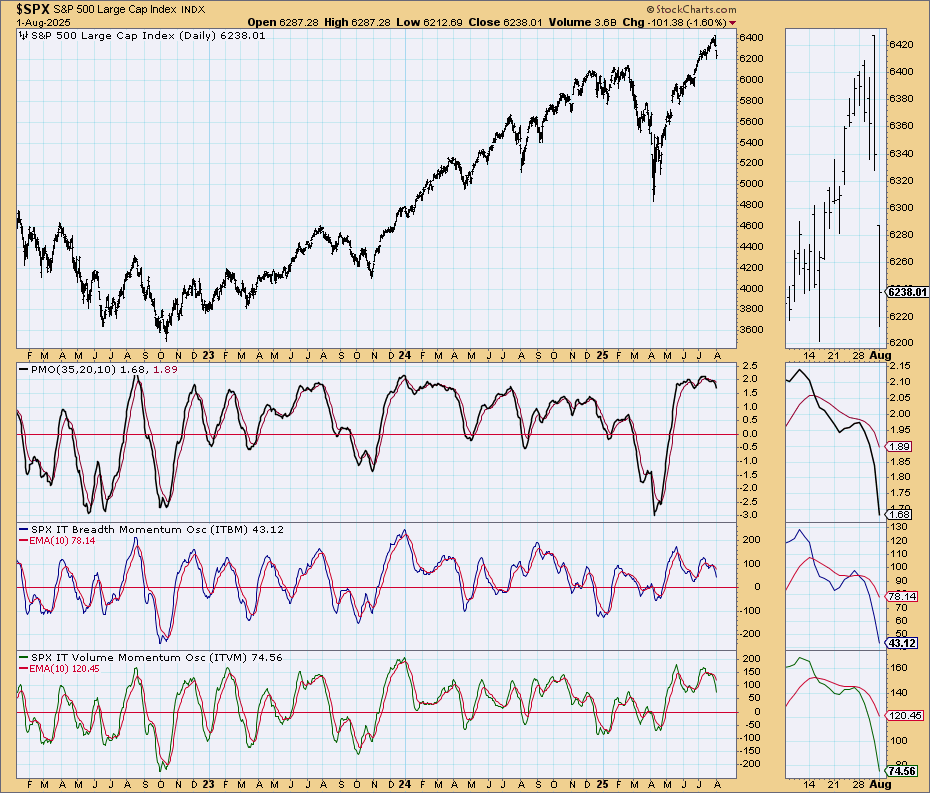
I believe we’re getting close to a nice sized pullback, but not tomorrow. The bpspx is in a precarious spot, and breadth and volume intermediate momentum is negative. RSI and MACD are close to overbought and turning down, respectively.
I’m not suggesting anyone short, but in my opinion we have about 1% upside from here. Tomorrow might be a good time to hedge. Nothing is shouting SELL now. It’s whispering hedge. Volatility is cheap right now.
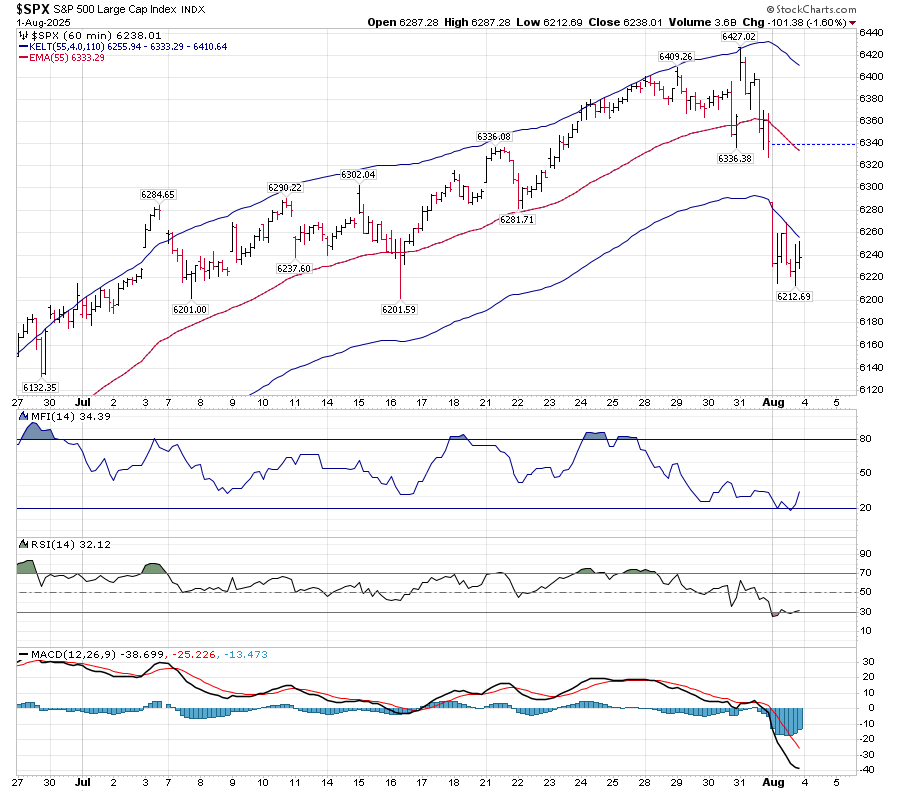
On Thursday, I noted the key reversal that occurred. Immediate resistance is 6255. I would like to see at least 2 bars above that (the lower Keltner band) before I would expect a bounce to hold.
Daily support is at 6122. Until that is broken, and RSI moves deeply below 50, one should be wary of a quick reversal. As I’ve pointed out, in a bull market, RSI tends to remain above 50.
Looking at this from a T-Theory perspective, my thoughts are that we won’t get a good bottom until September. The longer it takes to get to this bottom, the longer the T will last after it forms.
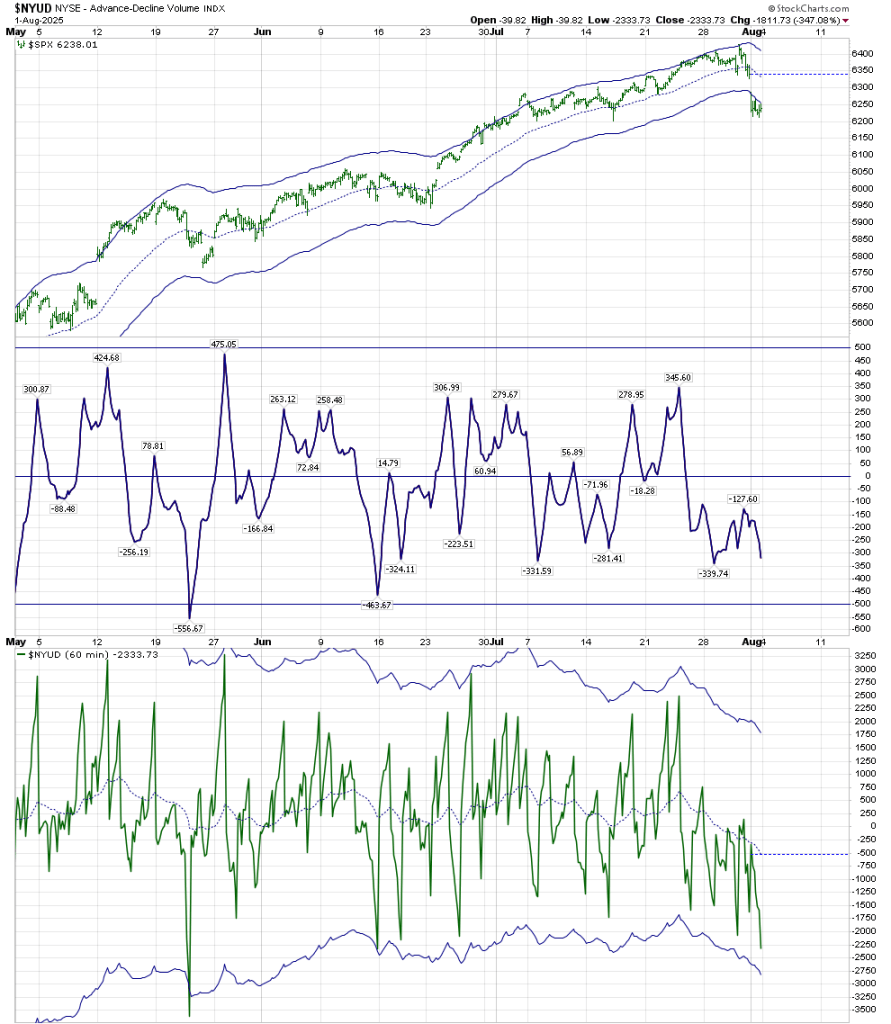
The hourly Volume Oscillator is showing complex, persistent selling. The NYUD itself is unable to get above that zero line, while the VO of that indicator has created a Complex bottom. This leads me to expect further weakness. (Yes, I have to keep the above comment regarding the daily RSI bull perspective in mind, but the below chart is a negative.)
BPSPX was one of two indicators that created caution. It is now below the lower keltner band. 50 is support, and until it breaks 50 it is a positive indicator. It can be a positive indicator but until it breaks back above the middle keltner it is not on a buy.
The Simple Chart is also an indicator that gave me concern 2 weeks ago, and has continued to move down. It has further to go before it hits the zero line, but its present high position is based on that extremely strong April move. It created a perch that has become a precipice.
The weekly chart I have been using for the last year is not based on Terry Laundry’s channels, but on the Optimum Moving Average for the NDX. I mentioned on elliottwavetrader.net about a month ago that this had the possibility of giving us a weekly RSI and MFI T into early next year. But it is receding from overbought. It needs to hold 5880 to maintain this possibility, and of course we can have shorter term daily T’s within it.
In contrast, I show Terry’s weekly chart, which can have us move all the way to 5616 before support on a weekly level is met, while still having that T through early 2026.
My present thoughts are that we continue lower for a while to create a better short term T. Investing at T bottoms and removing longs at a T’s end has allowed for positive additions with minimal downdrafts for the many years I’ve practiced and reviewed this concept. It kept me out of the 2020 and 2022 downdrafts, and even allowed for a more than double digit return in 2022 based on the short term T’s that were created. It’s hard not to have FOMO but the consistency of this technique’s returns have been worthwhile.


September 29th…watch that date.
LikeLike