I closed out my long trade based on T-Theory at 6013 on June 13, which was 2 weeks before the T was scheduled to end. Had I waited until June 24, I would have ended with Price at almost that level. But I had no angst regarding the 2% drop and recovery that followed.
There are a few things that can happen at the end of a Magic T. With an end to strength, the market could fall precipitously (more likely at the end of a Bear T), The market can continue a slow chug forward (as Terry Laundry expected the end of a T period of strength to create returns no greater than that of the Ten Year Treasury), or it can do what we’ve done here–continue on an accelerated path. Sometimes the least probable course is what occurs.
June 20 marked a low in the BPSPX, and it has since recovered to be back above the Keltner bands. Whenever it is above 50, it represents a positive environment. My personal thoughts are when it falls below the upper Keltner band (after being above it), it’s time to lighten positions. A cross below the middle Keltner channel might have given reason to short, but it never reached that level.

The Simple Chart (from Carl Swenlin) is an Intermediate Term chart showing Breadth and Volume Oscillators. This chart shows Breadth and Volume momentum slowly turning lower, after an amazingly sharp move off the April lows.
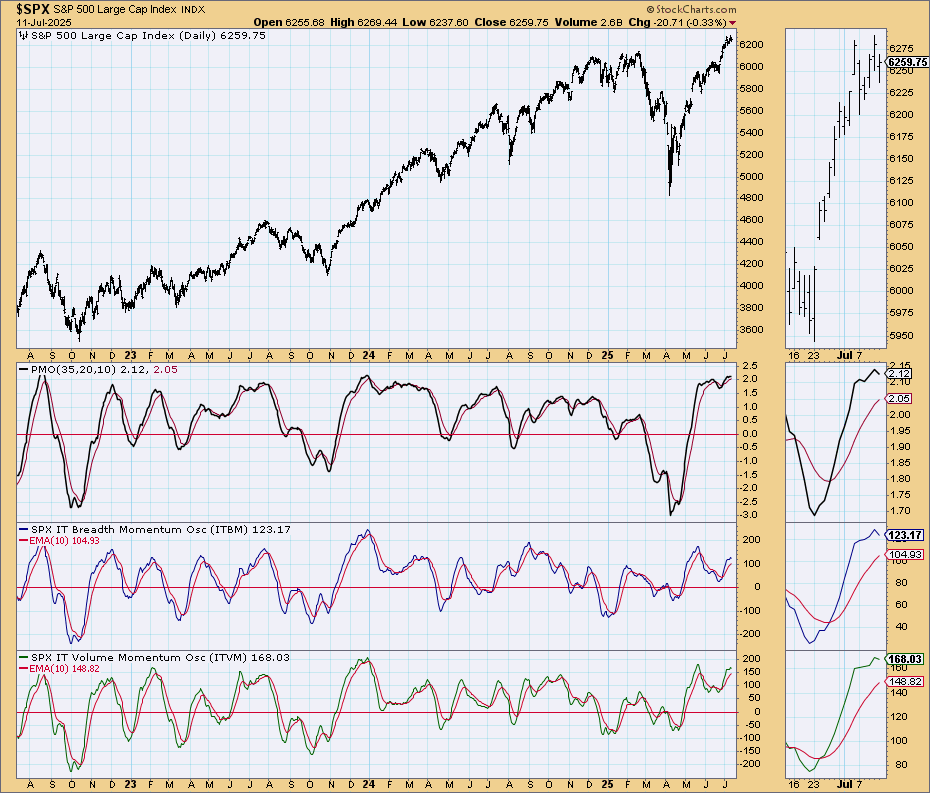
Both of the above tools are in my repertoire for use to confirm Magic T periods. They are preferred tools for swing trades, as opposed to short term Price movements. They confirm a trend, not initiate one.
My last post contained the following statement:
The difference between a trader and an investor can best be explained as one where a trader is willing to accept the risk of spotting the beginning of a trend change, as opposed to one who is willing to initiate or follow trends. The Venture Capitalist is an investor whose risk taking is based on trend creation. The worker with a passive 401K has his basic investing career set up for him via corporate guidance. There are multitudes of intermediate versions of the above criteria. Each one of them helps satisfy our primal emotions of Fear and Greed.
This site is dedicated to the T-Theory concept of Terry Laundry. The basic concept of T-Theory is based on periods of exceptional strength following a period of weakness. Since we have not had weakness in Price since the end of the last T, we are not creating the base for a new T based on Price. But…

At the end of his career, Terry was contemplating RSI and MFI Magic T’s. The above T chart is based on Terry’s 76 week Optimum Moving Average chart for SPX. (He didn’t use the main 55 daily OMA for his weekly chart.)
Back in the day, I questioned him regarding his use of the 100 week OMA on a vehicle similar to TLT, when I thought the 50 OMA had “more hits”. The OMA should be the Moving Average that has the most hits. In a similar vein, I am now using a Bull Market Weekly chart with a 38 week OMA as follows:
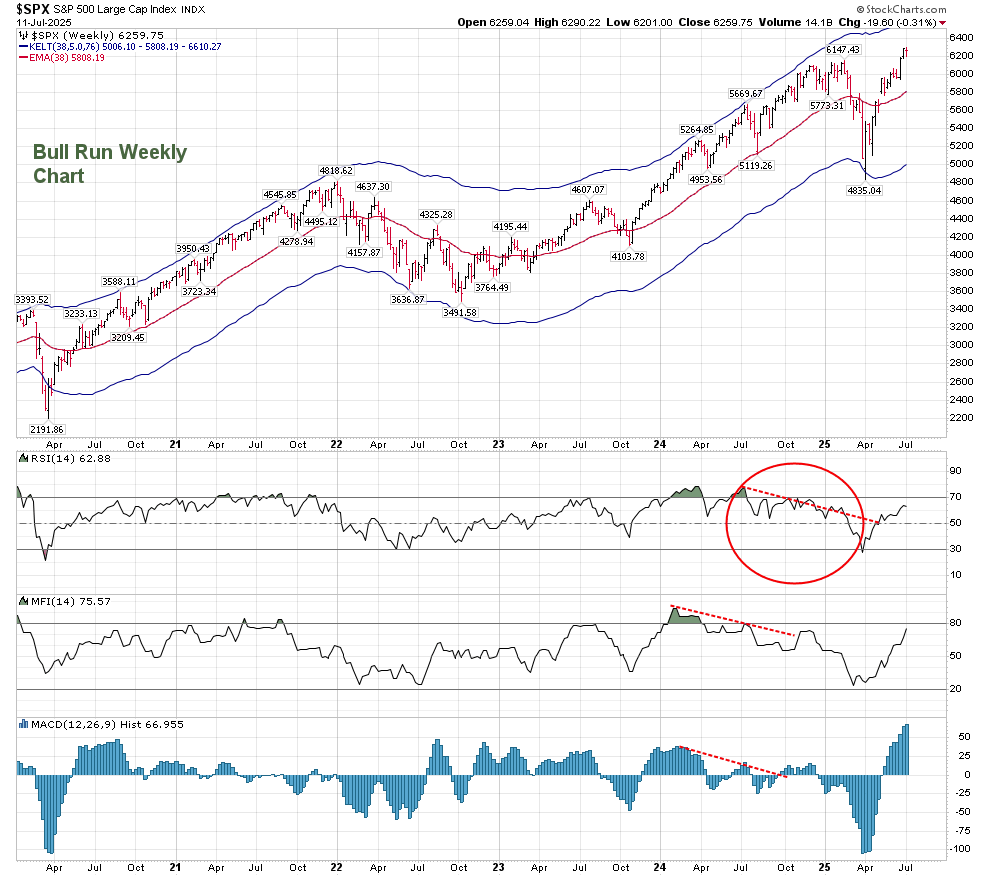
Its upper band is 6610. My first suggestion that this T may be in play was on June 29 on elliotwavetrader.net.
Looking at the daily T-Theory Chart, I am not expecting a new T to be created before the middle of September. We would need to see the VO and McOsci move to deep negative territory, meaning below -70.

How can we consider a daily T forming within the larger Weekly T? As long as we stay above 5800, that RSI T is probable. Weakness that takes us to that level brings us to support.

We’re overbought on daily technicals right now, but nothing is clearly broken.
If you are a trader, you will not be able to use this information, and I thank you for reading this far. If you’re an investor or swing trader, the parameters are shown above.
