Doom sells papers. But sometimes things are just what they appear to be. In the present case, we are just on a roll that will eventually end, but using the existing rules of T-Theory as I understand them, we are in a bullish Volume Oscillator (VO) T that will last until June 24.
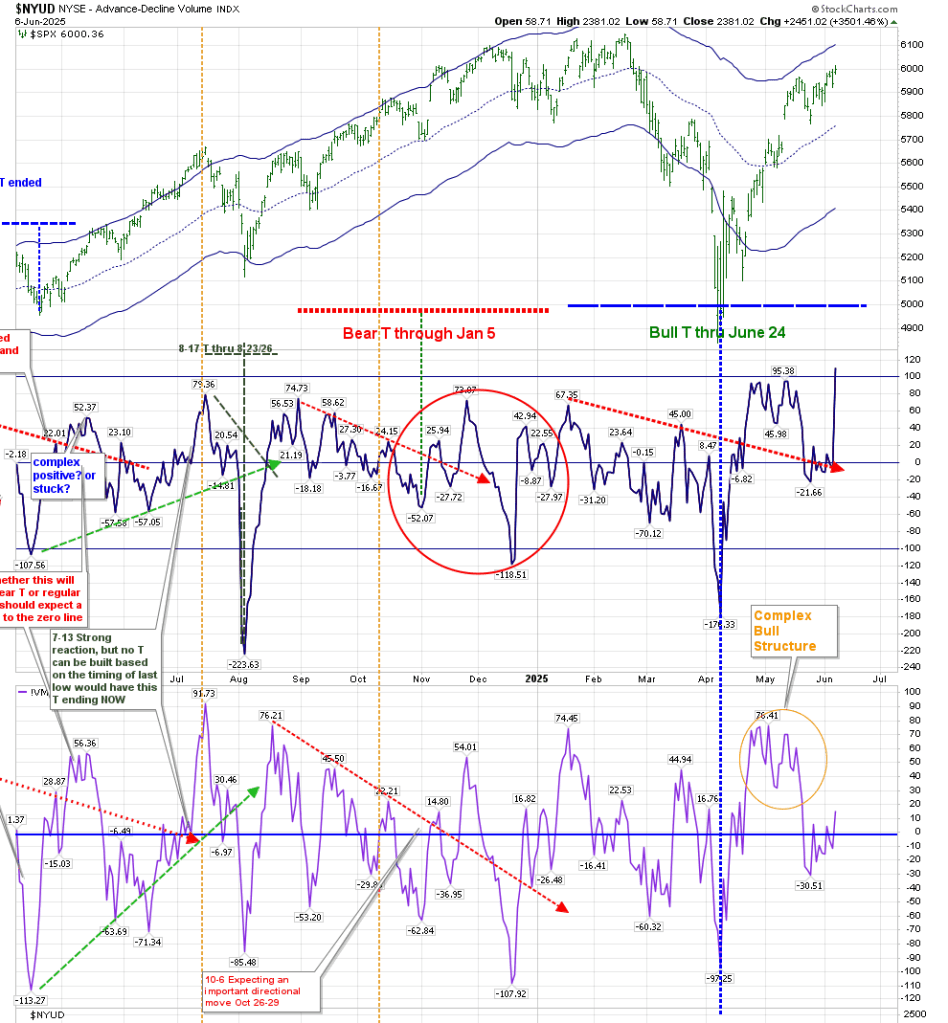
Our T’s this year have been very clear on direction. A Bear T ends with a rally at its end, followed by a collapse. That is what occurred , and it was then followed by the present Bull T which doesn’t need to collapse at its end–it merely ends the defined period of “extra” strength, after which we would expect equities to produce a return not above that of the ten year Treasury.**
The VO and McOsci have recaptured positive territory after making their expected returns to the zero line. Following the trading signals I’ve mentioned since on April 8 on elliottwavetrader.net, we’re up about 1000 points. The April 17 post (after a move off the lows of about 300 points) suggested an end to the rally. That was wrong. After missing the next 250 points, I confirmed the new T (on April 27) which we are following now. We had a Price T (in May) that I suggested would end around May 16, allowing us to capture some of that missed advance, as the market dropped 200 points. This offered a re-entry, or at least a hedging of positions.
While I still expect Price to climb through June 24, the bulk of this move is hitting what I consider a strong range of Price resistance. Friday’s high was just a point or two away from the lower part of a resistance zone I’ve been suggesting since January:
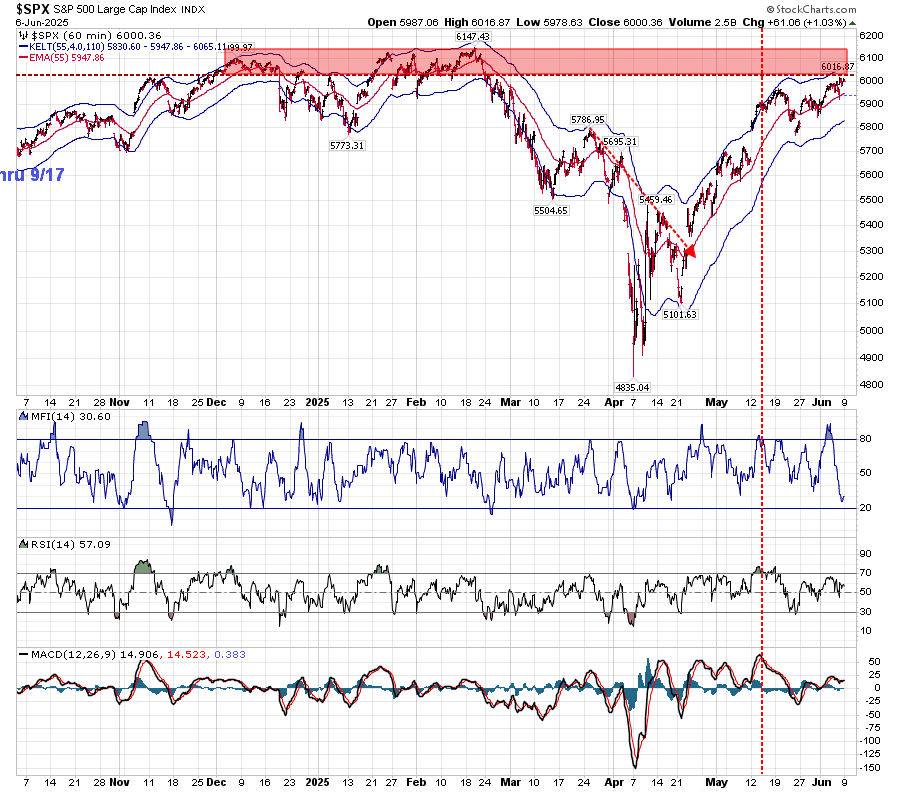
But while I’m on alert for a pullback, there’s very little technical confirmation of a change of direction at this time. BPSPX and the “Simple Chart” that I have used for years are not changing direction. Sometimes things are just what they appear.
There is a chance that June 17 can evolve into an early ending of strength, but it hasn’t developed into a reliable date at this time.
Counter to my thoughts on long term rates, TLT has advanced lately, but was stopped at the middle daily Keltner band:
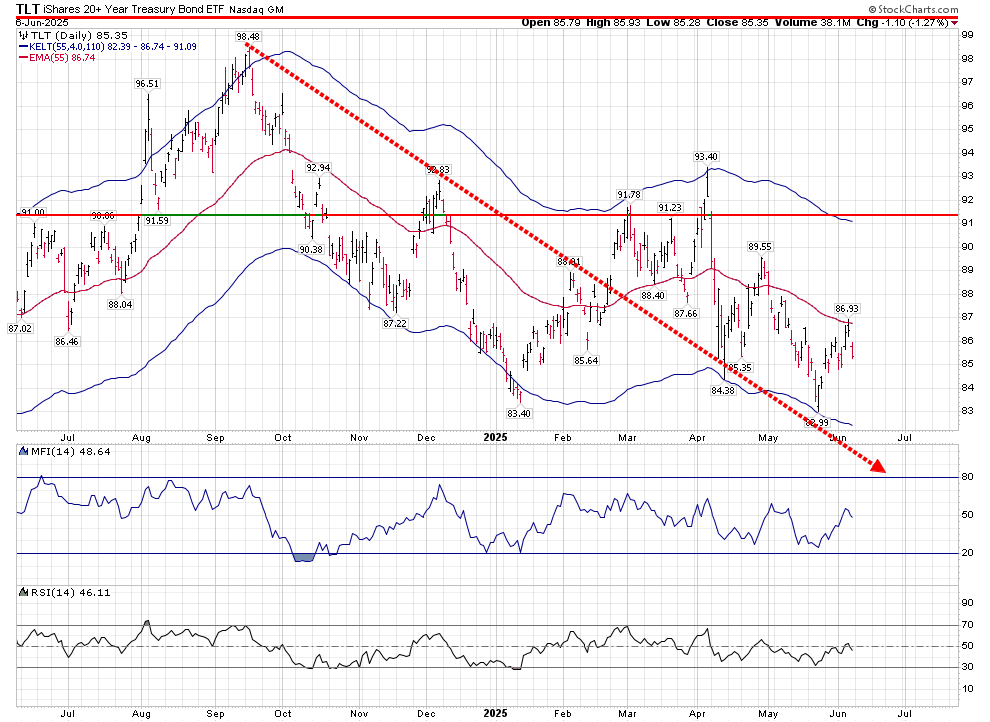
It needs to break above 87 to create traction.
**Coincidentally, I am seeing a critical event developing in the Ten Year Treasury rates just around the time the Equity T is scheduled to end:
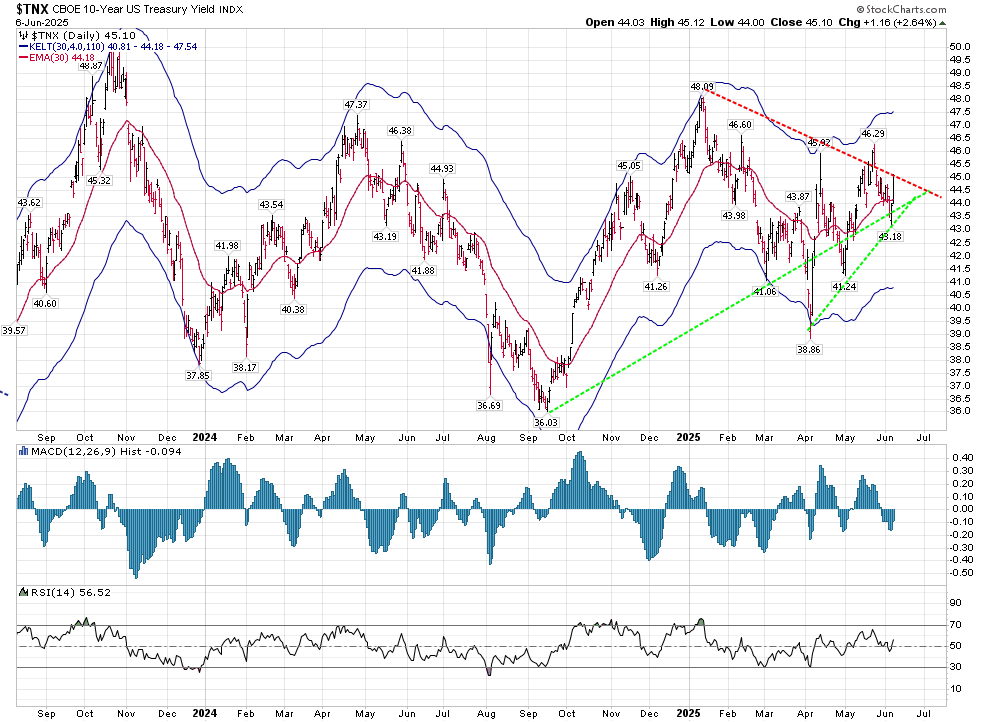
That last week of June should be “interesting.”
