Last week I projected a new T had been formed, missing one key ingredient–The Volume Oscillator and the McOscillator needed to move above the last descending peak reached before it moved below the zero line. I expected that momentarily, and that has still not occurred. We were also hoping for the VO and McOsci to stay above the zero line to create a Complex Bullish move, which they obviously have not.
I’ve changed that to a T not yet confirmed. I remind you that the VO shows a lower low than the center point of that new T, but it will be revised Monday by StockCharts. Right now, the McOsci doesn’t show that lower low, but I don’t expect a new T to begin until we get a reading below -100 and reverse. That is my base case at this time.

As we’ve moved below the midline support on the Bull Run chart I offered last week, I’ve returned to the normal Companion Chart. Support is 2% below where we closed on Friday–5765. There are two important things to note on this chart–RSI needs to stay above 50, and MACD is on the verge of crossing negatively on this Daily Chart.

For those members of elliottwavetrader.net, I had given warning not to short the market until the oversold readings on the hourly chart broke below their overbought readings on RSI and MACD. That occurred November 11.
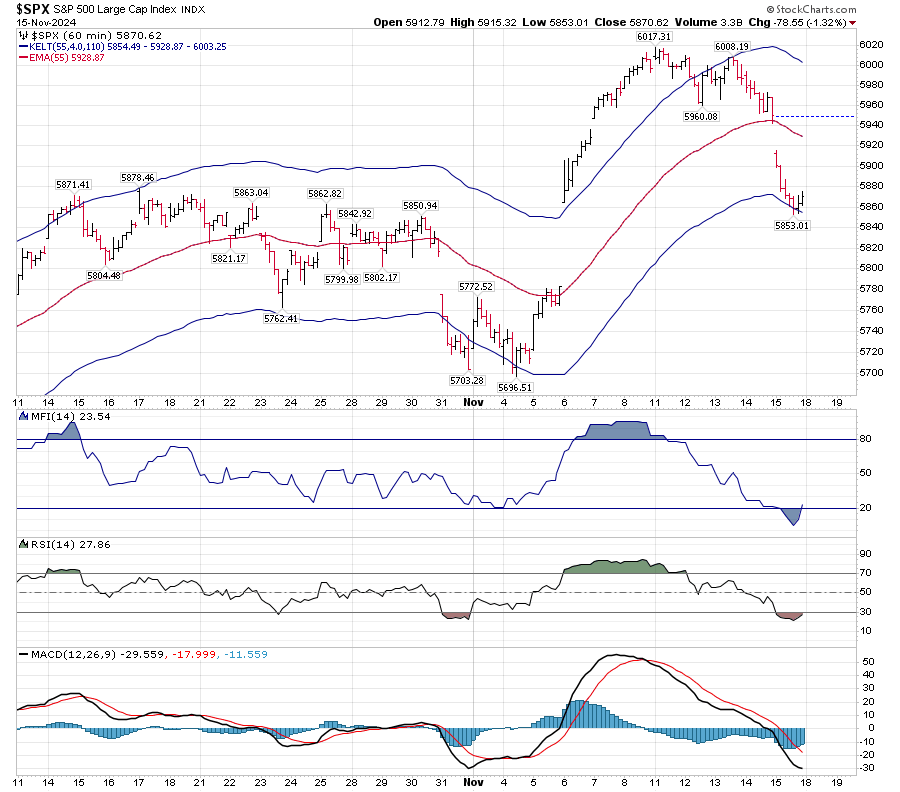
Right now, RSI is on the verge of crossing above its oversold level, but MACD has a few hours ahead of it before that can occur. We hit the low on the hourly Keltner Band a few hours before the close, and stabilized. That becomes an area of support, with resistance at 5928 for Monday.
5928 is 1% above where we closed Friday. On the Daily chart, 5765 is 2% below where we closed. I’ve pointed out over the years that we must keep in mind these percentages, rather than point moves. In 2009, a 6 point move was 1%–now it is 8 times that many points to hit 1%. Do institutions and retail customers make plans based on small percentage moves? Should you? And yet, I offer these points of resistance and support because they will tell us the overall strength or weakness of the market, when used together with T-Theory.
Terry Laundry felt that when there is no T, the market is not in a period of strength and may offer no better return than the 10 year Treasury. What does that mean when Treasuries are moving lower? It may mean hold onto your pants–or it may mean we are setting up for a reversal. When your primary means of reading a market gives you ambiguous readings, you look to retain your principal, and lower your risk. I have recently hedged my bond position by shorting high yield bonds.
Moving on to GLD, I luckily had a short leash on my re-entry at 245. I have no position there at this time. It is coming into deeply oversold territory very quickly, but I have no intention to re-enter. Should we hit 228, I will reconsider.

Most of my time is not market-oriented these days. You can’t be a swing trader when you can’t find a swing, so posts will be sporadic, including those on elliottwavetrader.net.
Best to you all
Bunker

As much as I am in the market and try to trade – i cannot get my arms around any of your charts and they seem exceptional. I feel like I am looking at sheet music. I missed your 2023 November posting that was on EWT and have been trying to get out of a barrel ever since. Text helps understanding charting but I see that you are doing less now so I hope you enjoy your freedom from this. all the best
LikeLike
Sorry. I’ve re-opened the Concepts page on my site. Maybe that will help you. Here is the link:
LikeLike