Last week I stressed that we were looking for a low, expecting a positive formation out of that low, and that support existed at 5695. The low for the week was 5696, and from there we just took off.
This T has passed all of the parameters of forming a T, with one major exception–neither the VO nor the McOsci have yet passed the last peak prior to moving negative. In the case of the VO, we are about 2 points below. In the case of the McOsci, we need to surpass 22.21. As members of Avi Gilburt’s elliottwavetrader.net site know, I expected both of these events to occur yesterday. If you accepted Terry Laundry’s Marine anecdote (posted here several times regarding landing on a beach outgunned and with no support–with your friends telling you how wrong you are), you approached support with an open mind, and rather than fear that support, you embraced it. Especially as we were expecting the formation of this T sometime in the near future.
Those members of Avi’s site benefitted from my post of November 3 regarding how the market proceeded after the last 2 elections–2016 with a T immediately announced (on November 9) with a timeframe of 5 months, and a 2020 T (also announced on November 9) lasting through January 6 2021.
So what do we have now? We have a VO T reaching through January 5 (to be fully confirmed should the VO move above its last descending peak above the zero line). It came very close to doing that yesterday. Again, as mentioned last week, I have no indication that this new T will become a Bear T. Normal behavior would have the VO move back to the zero line once more before it moves higher.
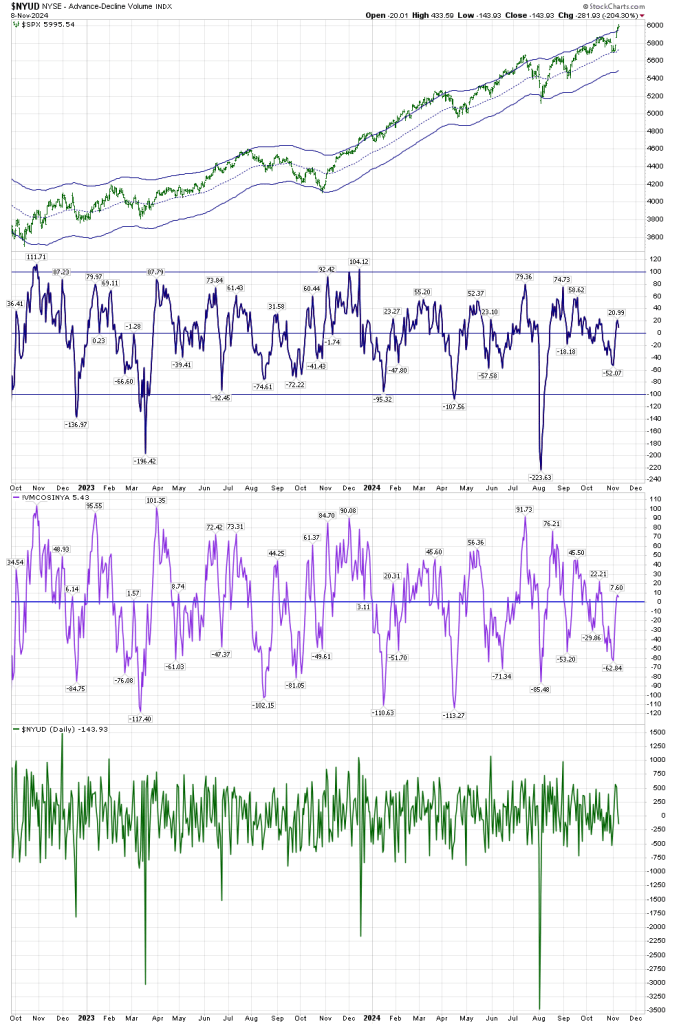
Next we would like to create a Complex Bull structure, where the VO and McOsci stay above the zero line for a long period of time. That is a further confirmation.
With this major move higher, we’ve moved back to where the 2024 Bull Run Chart more clearly defines the market’s support and resistance levels:
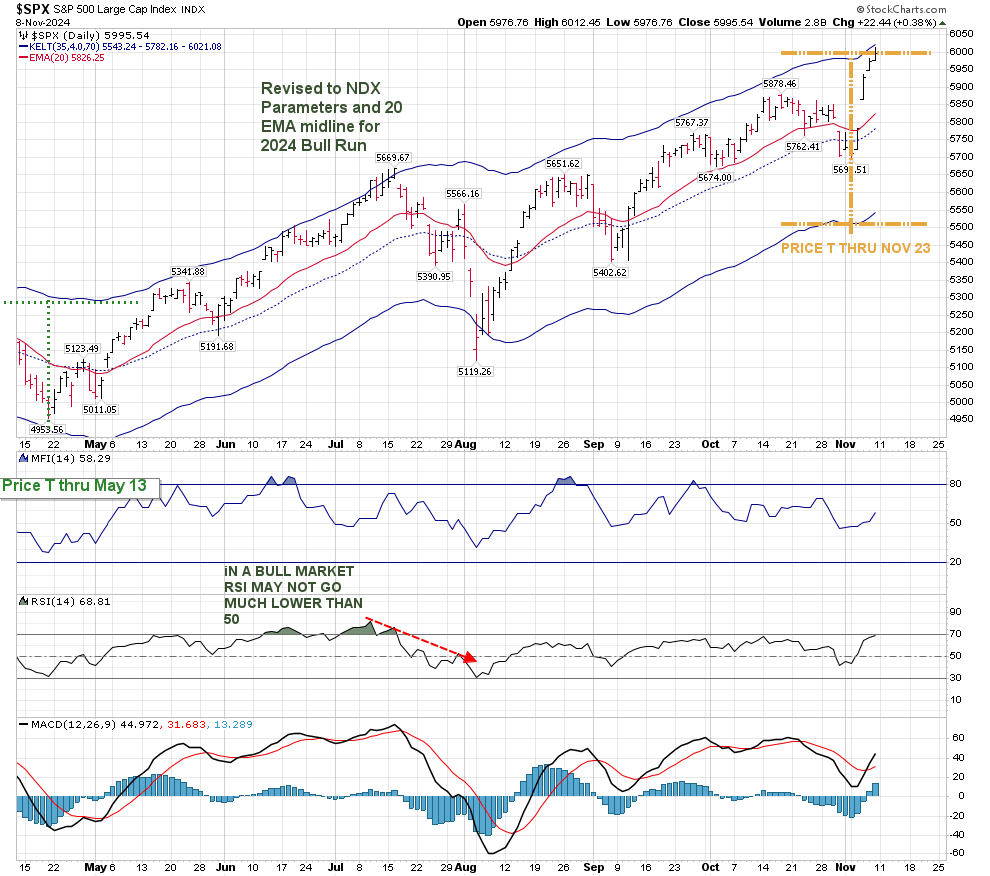
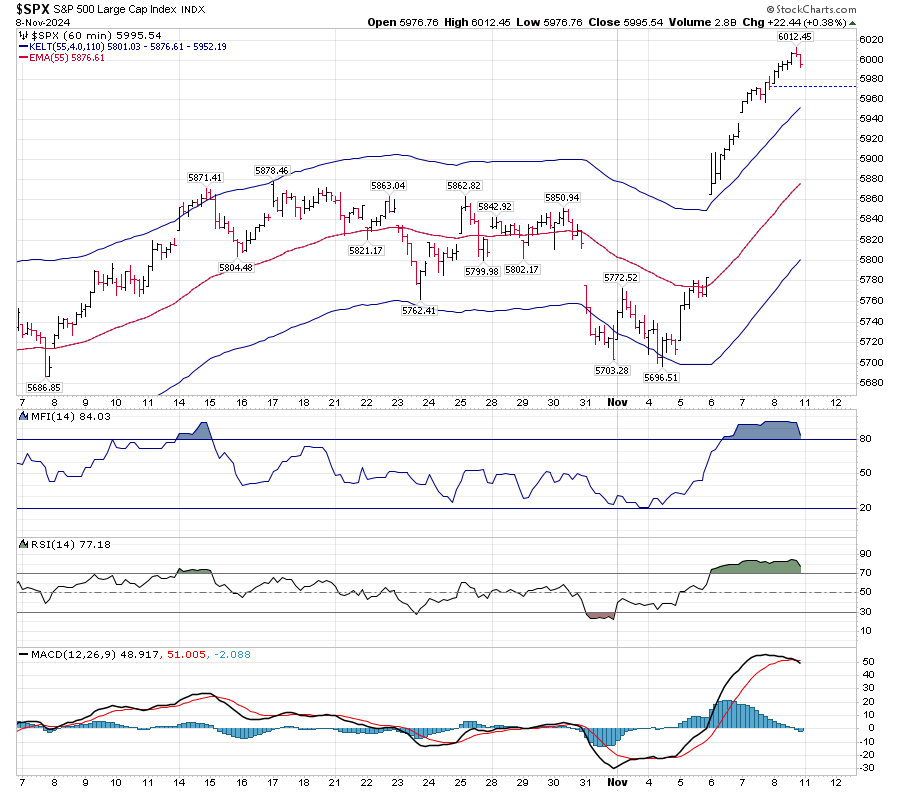
Similar to 2020, we have a shorter term Price T that should end November 23 shown above. I would suggest watching RSI and MACD for crosses lower, as the Hourly Chart shows them both in overbought areas. That being said, this new T is in its initiation phase, and the ability of the hourly internals to stay above their normal resistance levels should keep one from expecting a deep reversal.
Without a deep regard for fundamentals, the T charts were calling for a movement higher soon. There may have been a ton of funds that were going to be directed into this market once the election occurred under any outcome. The market is always looking forward to new areas of growth and concern. Fear and Greed work the short term levers of equities, but we should always try to add a dash of hope.
Keeping this short, TLT was up about 1.65% this week. We still have more than a year to go in its positive T, but it is a slow moving boat, and I continue to expect that to be the case.
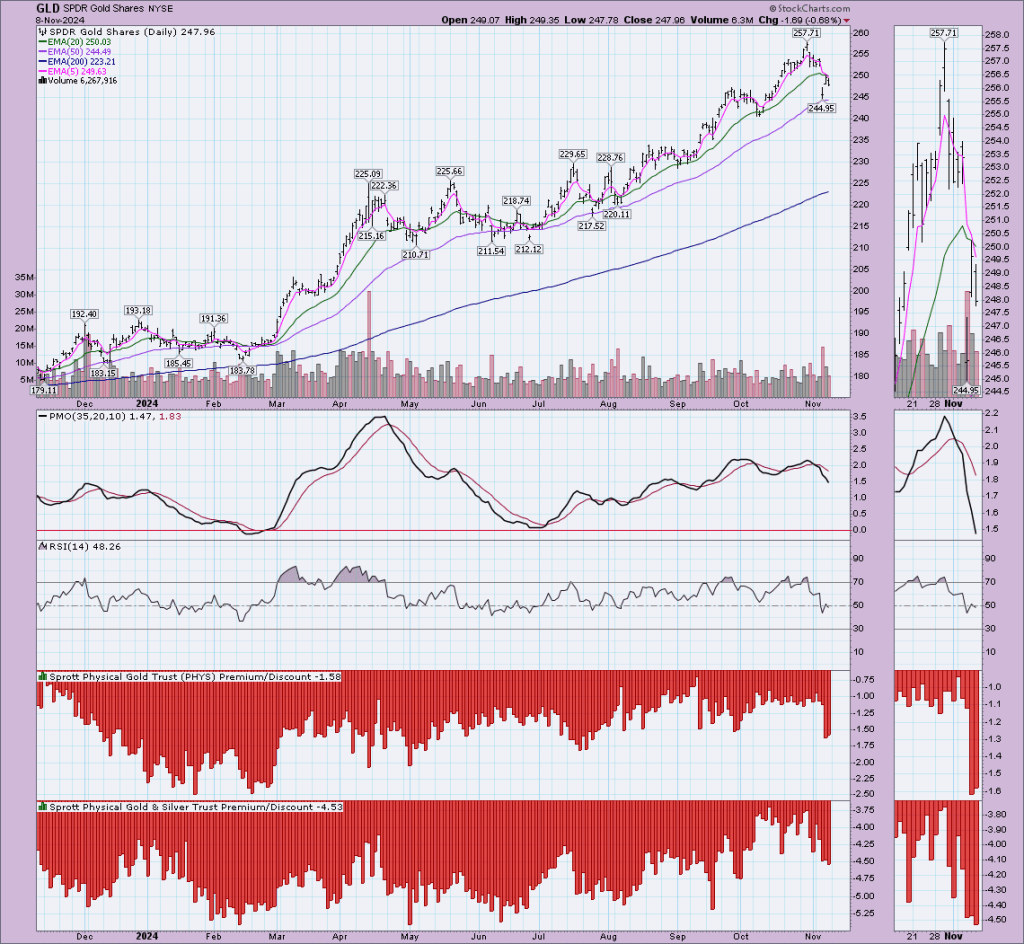
GLD was down about 1.7% for the week. I re-entered my GLD position at 245, after removing it at 252. We still have over a month on this T, however I am giving this a short leash. We weren’t able to break above the short term Moving Average which we hit on Thursday.
Best to your trading.
